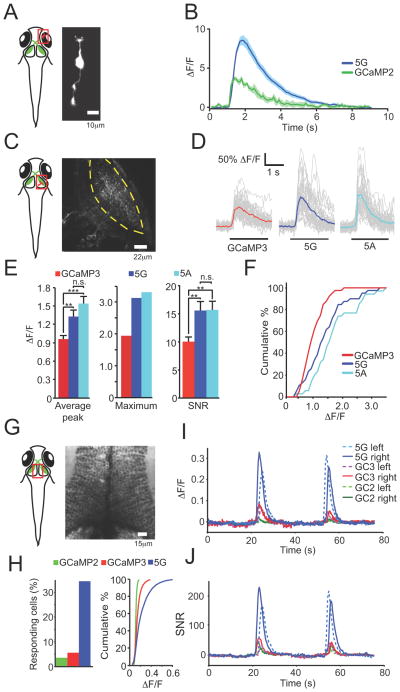
Figure 7. In vivo imaging in zebrafish.
(a) Schematic representation of area imaged (red square; retinal bipolar cell terminals) including fluorescence micrograph of bipolar cell. (b) 2-photon imaging of calcium spikes in axon terminals of retinal bipolar cells in Tg (Ribeye-A:GCaMP2) (green line), and Tg (Ribeye-A:GCaMP5G) (blue line) fish. Mean (± s.e.m.) of 20 spontaneous calcium spikes plotted. (c) Schematic of tectal neuropil imaged in zebrafish (red square). Micrograph with dashed yellow lines marking the borders of the tectal neuropil. (d) Imaging Ca2+ transients in RGC axons and tectal neuron dendrites in GCaMP3, 5A and 5G fish. Single-trial (gray) and trial-average (GCaMP3 red, 5A cyan, 5G blue) ΔF/F traces recorded during 2s visual stimulation to contralateral eye (black bars below traces); stimulus bar moves through the receptive field of the imaged neurons, and is unlikely to be visible to the imaged neuron for the entire 2s. (e) histograms depicting average (ΔF/F)max values (left), maximum (middle) (ΔF/F)max values, and SNR (right), over the neurons analzyed. Error bars are s.e.m., ** p<0.01, *** p<0.001, n.s.=not significant, two-tailed t-test. (f) Cumulative distributions of amplitudes of visually evoked calcium transients: p=0.03 for 5G, p < 0.001 for 5A (compared to GCaMP3); two-sample Kolmogorov-Smirnov test. For all experiments n ≥ 35 calcium transients recorded in ≥ 3 larvae. (g) Schematic of two-photon imaged location (optic tectum somata of Tg (elavl3:GCaMP2, 3, and 5G) fish) including micrograph. (h) Left: Fraction of cells with detectable response (for 5G versus GCaMP3: paired t-test, one-tailed p < 0.01). Right: cumulative histogram of peak ΔF/F values. (i) Trial-averaged (n = 11, 9 and 9 animals, for GCaMP2, GCaMP3 and GCaMP5G, respectively) responses to visual stimuli of top 50% of responding cells, ranked by peak ΔF/F. (j) SNR of trail-averaged responses. Cell traces were divided by the s.d. of 10 second preceding visual response. The average of this SNR-trace for each indicator is plotted.

