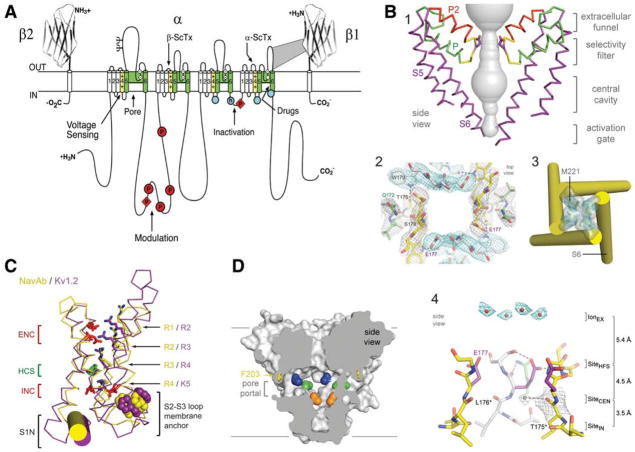
Figure 1.
Structure of voltage-gated sodium channels. A, Primary structures of the subunits of mammalian voltage-gated sodium channels. Cylinders represent β-helical segments. Bold lines represent the polypeptide chains with length approximately proportional to the number of amino acid residues. The extracellular domains of the β1 and β2 subunits are shown as Ig-like folds. Ψ, sites of probable N-linked glycosylation; P in red circles and diamonds, sites of protein phosphorylation by PKA and PKC, respectively; green, pore-lining segments; white circles, the outer (EEEE) and inner (DEKA) rings of amino residues that form the ion selectivity filter and the tetrodotoxin binding site; yellow, S4 voltage sensors; h in blue circle, inactivation particle in the inactivation gate loop; blue circles, sites implicated in forming the inactivation gate receptor. Sites of binding of α- and β-scorpion toxins (ScTx) and a site of interaction between α and β1 subunits are also shown. B, Architecture of the NaVAb pore. 1, Conformation of the pore-lining S5 and S6 segments and the P loop, containing the conserved P helix and the P2 helix unique to NaV channels. Glu177 side-chains, purple; pore volume, gray. 2, Top view of the ion selectivity filter. Symmetry-related subunits are colored white and yellow; P-helix residues are colored green. Hydrogen bonds between Thr175 and Trp179 are indicated by gray dashes. Electron densities from Fo–Fc omit maps are contoured at 4.0 σ(blue and gray). 3, The closed activation gate at the intracellular end of the pore illustrating the close interaction of Met221 residues in closing the pore. 4, Side view of the selectivity filter. Glu177 (purple) interactions with Gln172, Ser178, and the backbone of Ser180 are shown in the far subunit. Fo–Fc omit map at 4.75 σ (blue); putative cations or water molecules (red spheres, IonEX). Electron density around Leu176 (gray; Fo–Fc omit map at 1.75 σ) and a putative water molecule is shown (gray sphere). Na +-coordination sites: SiteHFS, SiteCEN, and SiteIN. C, Voltage-sensing module. Structures of NaVAb (yellow) and Kv1.2 (purple) are overlapped. ENC, extracellular negative cluster; HCS, hydrophobic constriction site; INC, intracellular negative cluster. R1–R4, gating charges of NaVAb; R2–K5 conserved gating charges of Kv1.2. D, Membrane access to the central cavity in NaVAb. Side view through the pore module illustrating fenestrations (portals) and hydrophobic access to central cavity. Phe203 side chains, yellow sticks. Surface representations of NaVAb residues aligning with those implicated in drug binding and block: Thr206 (blue), Met209 (green), Val213 (orange). Membrane boundaries, gray lines. Electron density from an Fo–Fc omit map is contoured at 2.0 σ.

