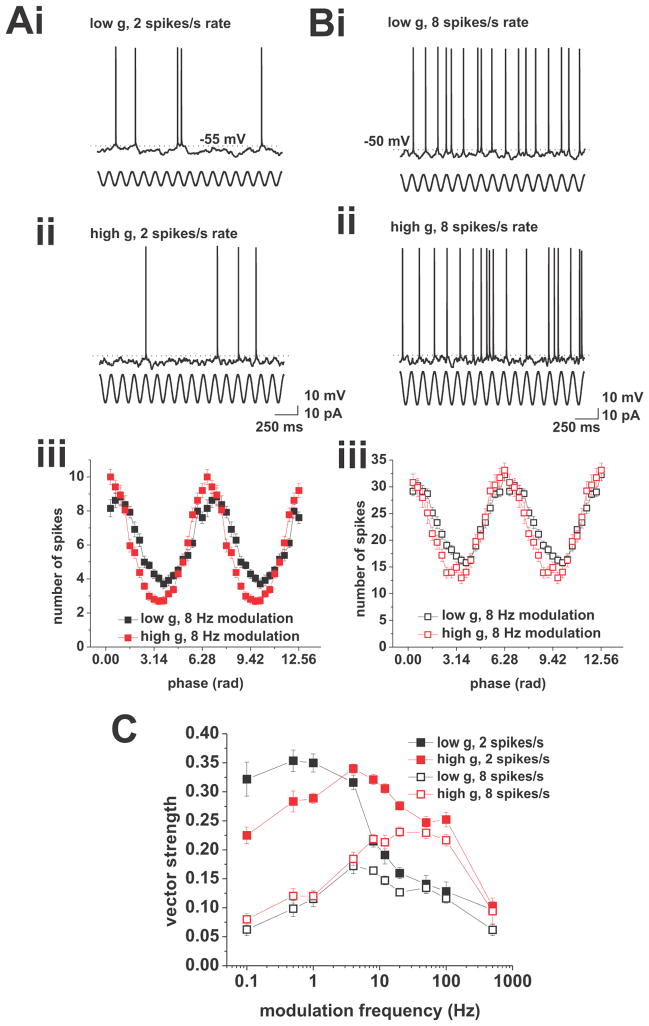
Figure 1.
Action potential phase locking in response to current-based cosines. A, Response to current-based cosines at average firing rates of 2 spikes/s under low (i) and high (ii) conductance. Sinusoidal modulation at 8 Hz is indicated below the voltage traces. (iii), Average spike-phase histogram in response to 8 Hz modulation at average spike rates of 2 spikes/s. Low conductance is shown in black, high conductance is shown in red. B, Response to current-based cosines at average firing rates of 8 spikes/s under low (i) and high (ii) conductance. Sinusoidal modulation at 8 Hz is indicated below the voltage traces. (iii), Average spike-phase histogram in response to 8 Hz modulation at average spike rates of 8 spikes/s. Low conductance is shown in black, high conductance is shown in red. (iv), Vector strength vs. modulation frequency under low (black) and high (red) conductance at average firing rates of 8 spikes/s. Tested modulation frequencies were: 0.1, 0.5, 1, 4, 8, 12, 20, 50, 100, and 500 Hz. C, Overlay of vector strength vs. modulation frequency plots for low (black) and high (red) conductance at average firing rates of 2 (closed squares) and 8 (open squares) spikes/s. Tested modulation frequencies were: 0.1, 0.5, 1, 4, 8, 12, 20, 50, 100, and 500 Hz.

