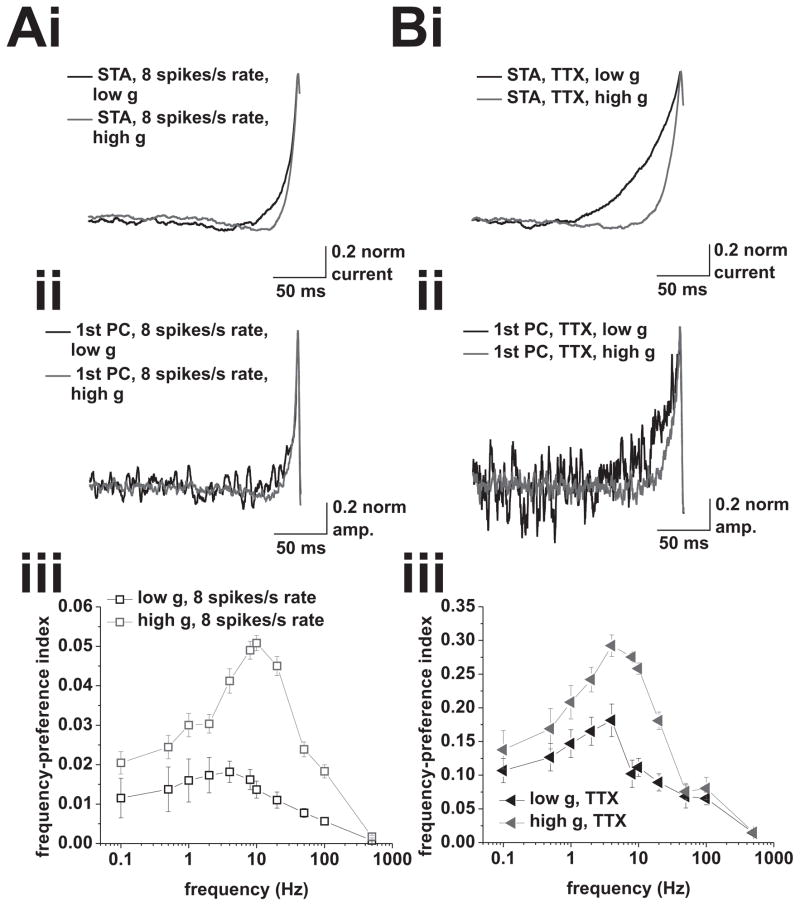
Figure 8.
Principal-component analysis of spike-triggering events at 8 spikes/s mean rate under control conditions, and at 2 (low g) and 1.5 (high g) spikes/s mean rate in the presence of 5 nM TTX. A, (i), Spike-triggered averages of the input current for mean firing rates of 8 spikes/s under low (black) and high (red) conductance. Input currents used to measure spike-triggering events in neurons did not include any frequency modulation. (ii), Average 1st principal components of the spike-triggering events under low (black) and high (red) conductance at mean firing rates of 8 spikes/s. (iii), Frequency-preference index of the 1st principal components under low (black) and high (red) conductance. Tested modulation frequencies were: 0.1, 0.5, 1, 2, 4, 8, 10, 20, 50, 100, and 500 Hz. B, (i), Spike-triggered averages of the input current for mean firing rates of 2 (low g, black) and 1.5 (high g, red) spikes/s, in the presence of 5 nM TTX. Input currents used to measure spike-triggering events in neurons did not include any frequency modulation. (ii), Average 1st principal components of the spike triggering events under low (black) and high (red) conductance in the presence of 5 nM TTX. (iii), Frequency-preference index of the 1st principal components under low (black) and high (red) conductance. Tested modulation frequencies were: 0.1, 0.5, 1, 2, 4, 8, 10, 20, 50, 100, and 500 Hz.

