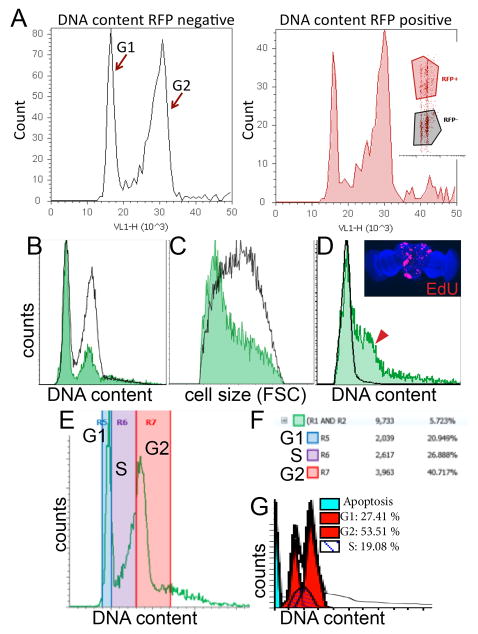
Figure 3. Representative histograms of cell cycle and cell size analysis for various developmental stages and tissues.
(A) Representative histogram data is shown for comparing cell cycle in specific cell types using RFP expression with DyeCycle Violet (inset shows scatter plot of RFP fluorescence vs. DNA content). This example contains larval wings expressing RFP in the posterior, driven by an engrailed-Gal4 transgene. (B) Overlays of GFP positive vs. GFP negative DNA content histograms in larval eyes with GFP expression driven by the GMR-gal4 promoter17, showing most GFP positive cells in G1. (C) Smaller relative cell size of GMR driven GFP+ cells compared to GFP- controls, as measured by forward scatter using Gates 5 and 6. (D) In the pupal brain, GFP positive cells indicate heat-shock induced lineage tracing clones via flp-out method5 induced during the 2nd larval instar, over-expressing the G1-S cell cycle regulators Cyclin D and E2F, causing aberrant S-phase entry (red arrowhead) in the normally postmitotic G1 arrested tissue. The abnormal S-phase entry observed by flow cytometry was confirmed by incorporation of EdU, which labels cells in S-phase (inset). (E) Example of regions used to estimate relative percentages in G1, S and G2 phases. Boundaries were estimated based upon S-phase incorporation of EdU in Drosophila cells in a separate experiment. (F) Example of statistics table generated by Attune software showing relative percentages in the regions defined. (G) Example of cell cycle modeling of representative Attune data using ModFitLT™.

