Figure 3.
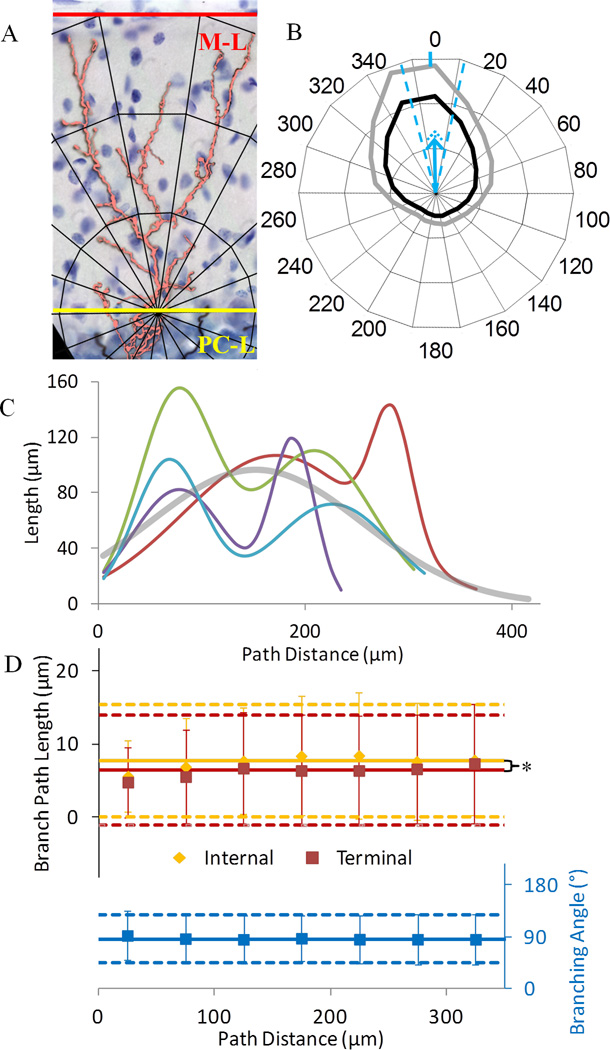
Morphometric distributions across distance. A. Representative CF orientation toward the cortical surface, through the molecular layer (M-L, red) and perpendicular to the Purkinje cell layer (PC-L, yellow). B. Polar histogram of the fraction of CF length in each angular bin. The inner circle represents uniform spatial distribution. The second and third concentric circles demark fractional lengths twice and three times the bin average, respectively. Black and gray lines are mean and mean plus standard deviation of fractional length across CFs. For example, length in the 0° bin is on average more than twice as large as in the 60° bin. The vertical blue tick on the outer circle near the 0° label and the blue dashed lines represent respectively mean and standard deviations of polar direction across CFs. The polar magnitude mean and standard deviation (blue and dotted arrows, respectively) are 0.37±0.09, where equal directionality across all bins would yield a value of 0 (at the circle center), and all length being within the 0° bin would yield a value of 1 (outermost concentric circle). C. Variable but consistently bimodal length distribution across path distance for four representative CFs (different colors). The average across all CFs (thick gray) is unimodal. D. Constant branch path length (N=22,254) and bifurcation angle (N=11,127) across path distance. Internal branches are significantly longer than terminal branches at path distances between 75 and 275 µm. Error bars are standard deviations. The number of branches ranges by bin from 207 to 2197. Solid and dashed lines represent grand mean and standard deviation, respectively.

