
Figure 2.
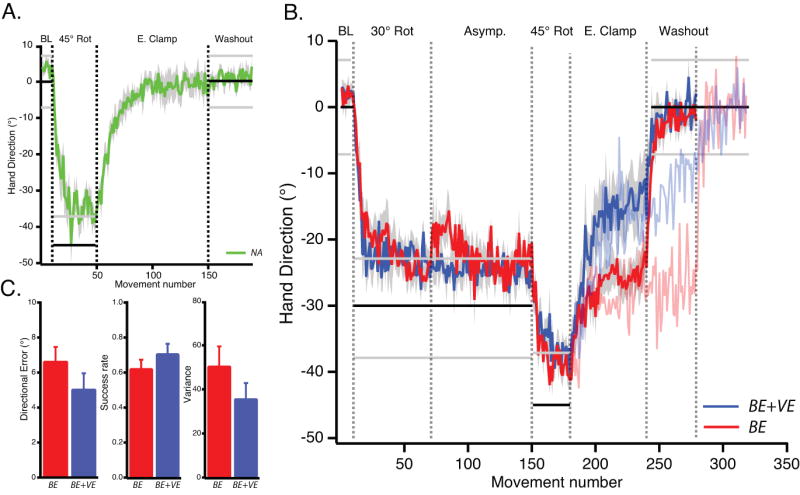
A. Averaged hand movement direction plotted against movement number for the NA group (green). Horizontal lines indicate the center (black lines) and edges (grey lines) of the target. Binary feedback was only given when movement direction was between the grey lines. Shading indicates SEM. During the error clamp block, subjects rapidly decay to their baseline mapping.
B. Averaged hand movement direction plotted against movement number for the BE group (red) and BE+VE group (blue). While both groups adapted to the 45° rotation, group BE decayed less in the subsequent error clamp block. Faint red and blue traces depict the behavior of 6 additional subjects (3 BE and 3 BE+VE subjects respectively) that experienced a longer error clamp block (continued until the rightmost dotted vertical line).
C. Group averages for performance measures at asymptote for the 30° rotation for BE (red) and BE+VE (blue) groups (last 20 trials of the asymptote block).