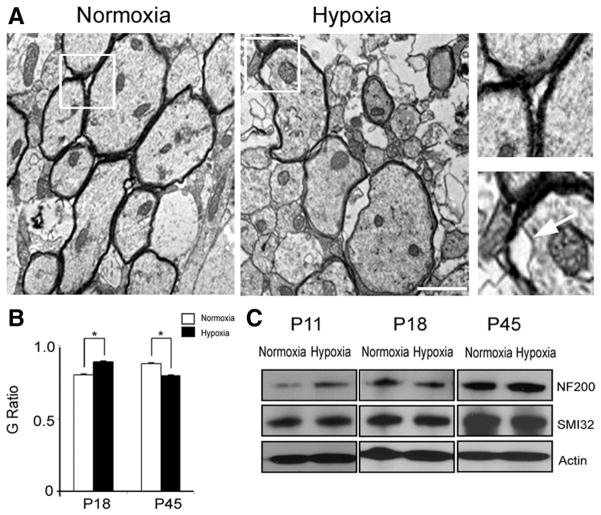
Figure 4.
Cellular recovery in oligodendrocytes does not correlate with proper axonal myelination. A, Ultrastructure of myelinated and unmyelinated axons in the corpus callosum region after normoxia and hypoxia at P45. Scale bar, 1 μm. Higher magnification of images demonstrate proper axonal myelination (left panel, normoxia) and loosely wrapped, delaminated myelin (right panel, hypoxia). The white arrow points to loosely wrapped myelin. B, Graph represents significant changes in G ratios after hypoxia compared with normoxia at P18 and P45 (n = 3 brains; total number of axons analyzed ranged between 38 and 49 for P18, and 32 and 56 for P45; *p < 0.04). C, Western blot analysis from normoxic and hypoxic white matter demonstrates no changes in neurofilament protein expression (NF200, total, and SMI 32, nonphosphorylated) at P18 and P45. Hypoxia upregulates the expression of NF200 at P11 (n = 3 brains for each condition and each marker; *p < 0.05, t test). Error bars indicate SEM.

