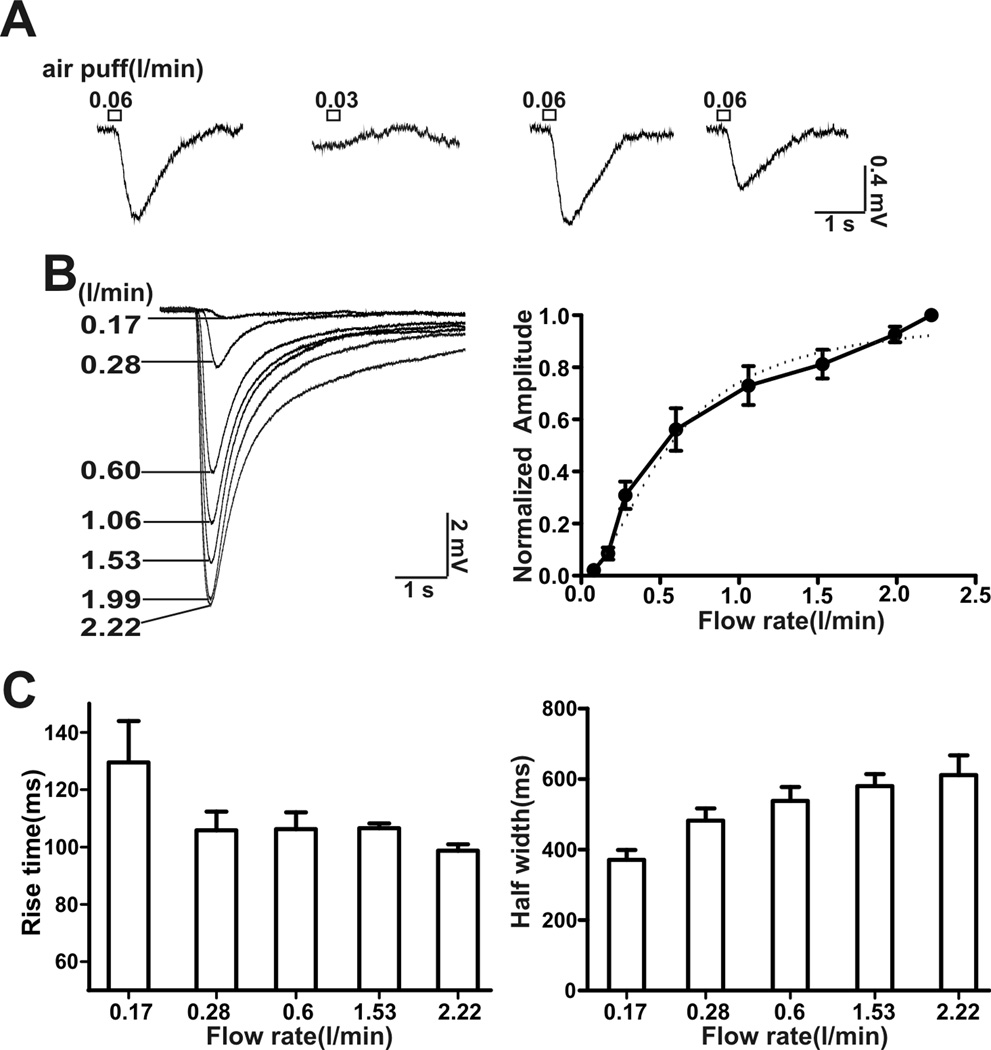
Figure 2.
Threshold for activation and EC50 for the EOG airflow-sensitive response. A, Determination of the threshold for airflow activation. Representative EOG traces from one recording site. A flow rate of 0.06 l/min, but not of 0.03 l/min, stimulated an airflow-sensitive response, puff duration: 200 ms, n = 6.B, EOG traces at different airflow rates up to 2.22 l/min are shown. Right, plot of airflow-sensitive responses (amplitude normalized to the maximum) versus flow rate. Dose-response data was fitted with the Hill function (dash line). The EC50 was 0.62 ± 0.08 l/min (n = 8) with a Hill coefficient of 2.2 ± 0.3 (n = 8). C, the rise time for activation (20–80%) (left) and half-width of the airflow-sensitive response (right) at various flow rates.

