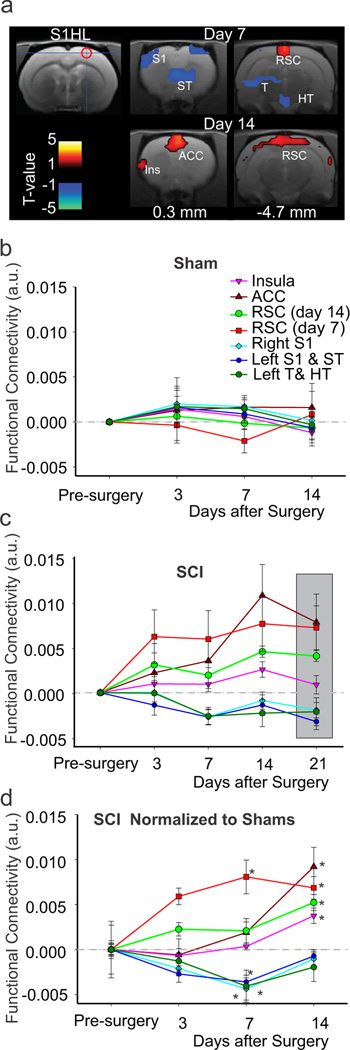
Figure 3. S1HL functional connectivity over time.
(a) Connectivity of the right S1HL seed region (cross hair and red circle) and clusters that show increased (red) or decreased (blue) connectivity relative to sham animals at days 7 and 14 post-injury. (b) Change in functional connectivity, relative to baseline, of the right S1HL seed and the clusters shown in (a) at days 3, 7 and 14 after sham injury. (c) Change in functional connectivity, relative to baseline, of the right S1HL seed and the clusters shown in (a) at days 3, 7, 14, and 21 after SCI. Gray box is used to highlight day 21 results. (d) Plot of all the clusters in (a) showing increased or decreased connectivity at all time-points in SCI animals relative to sham (gray line) and pre-injury. For cluster details refer to Table 1. * significant cluster-corrected at this time-point compared to shams. Error bars S.E.M. ACC: anterior cingulate cortex; Ins: insula; RSC: retrosplenial cortex; ST: striatum; see Figure 2 for other abbreviations.

