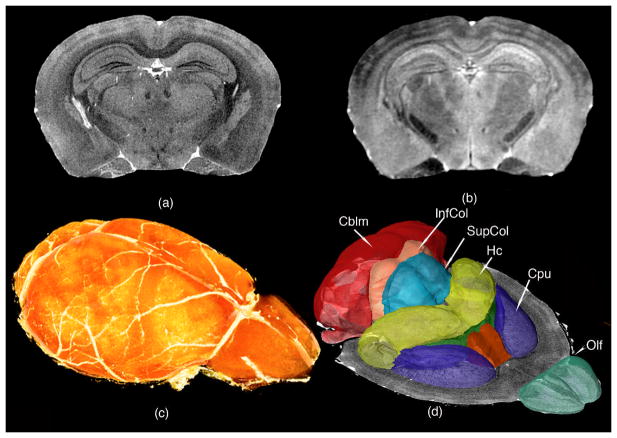
Figure 10.
(a) T1-weighted and (b) T2-weighted images of the actively stained mouse brain offer rich contrast to differentiate and segment brain regions, and can help determine the genetic basis of their volume variation; (c) Volume rendered T1 image showing the brain surface; (d) Surface rendering of structures that have been segmented and quantified, including olfactory areas (Olf), striatum (CPu), septal nuclei, fimbria, hippocampus (Hc), superior and inferior colliculi (SupCol, InfCol), and cerebellum (Cblm). Reprinted with permission from (Badea, Johnson et al. 2009).

