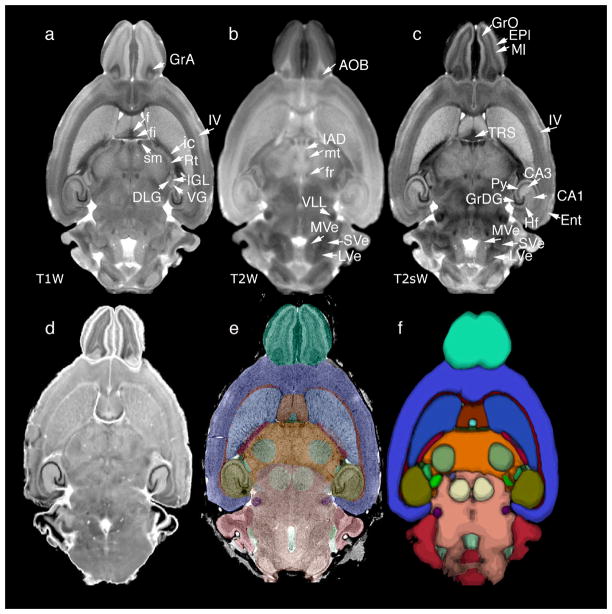
Figure 11.
multiple specimens imaged with MRM have been used to generate population-averages: (a) T1-weighted (T1W), (b) T2-weighted (T2W), and (c) T2*-weighted (T2s); (d) also a 3D volume of Nissl histology was acquired on one of the specimens; (e) labels defined on the one specimen atlas images can be used to map other mouse brains; (f) labels from multiple specimens have been used to produce a probabilistic atlas that gives insight into volume and shape variability. Modified and reproduced with permission from (Johnson, Badea et al. 2010).

