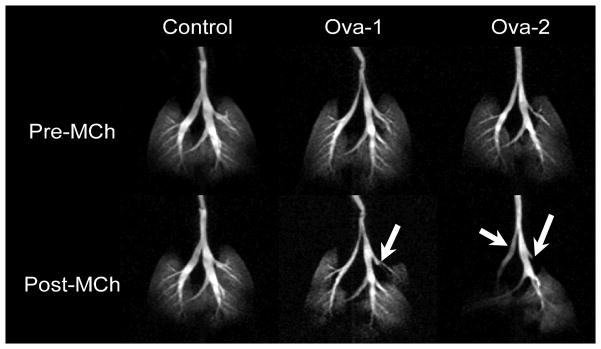
Figure 17.
Gas exchange in the mouse lungs of models of asthma (Ova sensitized) compared to a control animal. Maximum intensity projections based on 3D (radial acquisition) images of 3He distribution in the lungs before and after administration of 250 μg/kg methacholine (MCh) challenge. The image were aquired using TR = 5 ms, TE = 132 μs, bandwidth (BW) = 62.5 kHz, with 20 radial k-space views per breath, interpolated to 256×256×16 matrix and resolution is 125×125×1000 μm3. Airways constriction is indicated with white arrows in the Ova-sensitized mice. Reproduced with permission from (Driehuys 2007).

