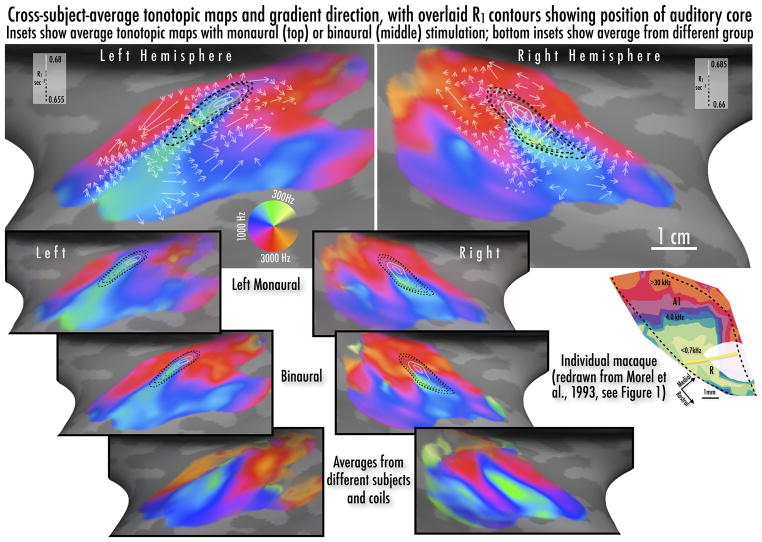
Figure 5.
Combined tonotopic maps, gradients and R1 contours from group averages. Colormap shows fMRI results for characteristic frequency with logarithmic scaling in Hz around the color wheel. The angle of the overlaid white arrows shows the tonotopic gradient direction from low-to-high frequency preference at approximately 1/3 octave steps within tonotopic maps (perpendicular to isofrequency contour), with arrow length reflecting the approximate magnification factor (reciprocal of gradient vector). Dots indicate points where the gradient direction was unclear or interrupted. Dashed lines show R1 values in grayscale-coded steps of 0.005 sec−1 (same data as Figure 4); curved yellow line is suggested A1/R border based on presence of low-frequency reversal and R1 contour. Top and middle inset figures show tonotopic averages with left monaural and binaural stimulation from the same subjects as in the combined average. Bottom inset shows comparison tonotopic averages from different sets of participants and experimental setups; all tonotopic maps were identically masked using the independent auditory localizer (see Methods).

