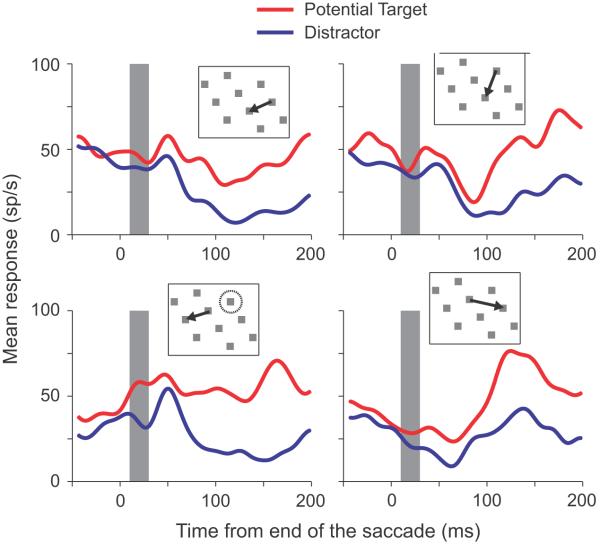
Figure 6.
Mean responses from a single neuron for four different saccades. Mean responses from fixations in which a potential target (red traces) or a distractor (blue traces) were brought into the receptive field by a saccade, aligned by the end of the saccade. The inserts show the stimulus locations, saccade directions and, in the lower left insert, the location of the response field relative to the pre-saccadic fixation location. The vertical gray bars show the remapping period, a 25 ms window centered 20 ms after the end of the saccade.

