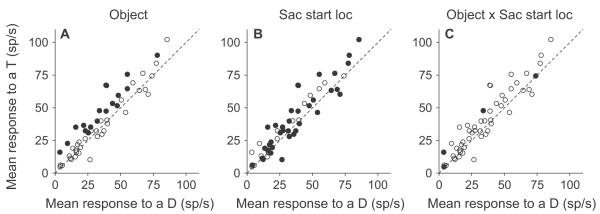
Figure 7.
Results from the 3-way ANOVA. A, B, C, The results from the 3-way ANOVA are illustrated on plots showing the mean response to a potential target plotted against the mean response to distractor for each neuron. Filled circles indicate which neurons had a main effect of object category (A), which neurons had a main effect of starting location (B) and which neurons had an interaction between object and starting location (C).

