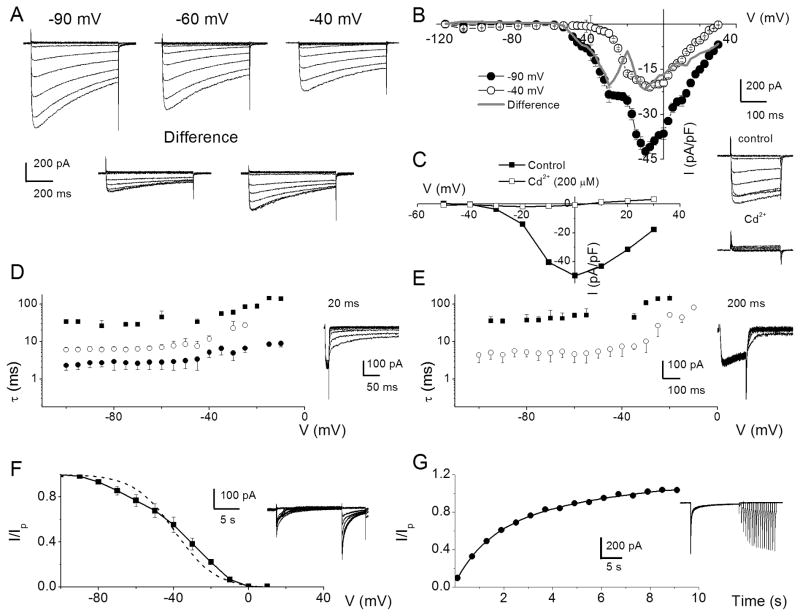
Figure 2. Whole-cell Ca2+ currents in SGNs may contain several components.
A A family of membrane Ca2+ current traces recorded from SGNs using 5 mM external Ca2+. Inward Ca2+ currents were generated using depolarizing test voltages from −120 to 30 mV in 2.5 – 10 mV increments from a holding voltage of −90 mV. Current traces recorded from the same neuron from a holding voltage of −60 and −40 mV. The difference between current traces recorded at −90 and −60 mV (inset, left panel) and −90 and −40 mV (inset, right panel) holding voltages. B Summary of the corresponding current-density-voltage (I–V) relations for recordings at −90 (●) and −40 (○) mV holding voltages together with the difference (difference between currents at −90 and −40 mV) current densities is shown in the gray line. Data were summarized from n = 15. C A family of control current traces generated from a holding voltage of −70 mV. (inset right panel). After application of Cd2+ (200 μM), the whole-cell Ca2+ current was blocked (inset as indicated). The corresponding I–V relations are shown (control in ■, and Cd2+ in □). D SGNs were held at −80 mV and Ca2+ currents were elicited for 20 ms to 10 mV. At the end of the pre-pulse, the membrane voltage was polarized to different test voltages in 5-mV increments (between −100 and −5 mV), and the kinetics of the tail currents were examined. E A similar protocol was applied using a 200-ms pre-pulse. The current traces are shown as insets. Summary data of the relations between the time constant of deactivation (■, ●, ○) and test voltages using 20-ms (D) and 200-ms (E) pre-pulses (n = 10). Invariably, multiple deactivation time constants were documented using shorter pre-pulse voltages. Three time constants were derived using 20-ms pre-pulse. In contrast, two time constants best fitted the deactivation kinetics using 200-ms pre-pulse. F Exemplary current traces elicited to generate steady-state inactivation curves depicted in inset. The neuron was held at −70 mV and stepped to conditioning voltages varying from −100 to 40 mV for ~15 s, followed by a test voltage at 10 mV. The current was normalized against the non-inactivating component evoked at the test voltage. The dotted curve represents a first order Boltzmann function fit. However, the data was best fitted with a second order Boltzmann function, in solid line. The half-inactivation voltages (V1/2-1, mV) were −65 ± 8 (at ~35% contribution) and (V1/2-2) −32 ± 3 (at ~65% contribution) (n = 9) and the maximum slope factors (k, in mV) were 9.0 ± 1 and 10 ± 2. (n = 9). G Neurons were held at −80 mV and stepped to conditioning pre-pulse (10 mV) to make a transition from activation to inactivation. Subsequently, test pulses at varying time intervals were applied. The traces shown as inset are a family of currents obtained after applying a set of pulses as described. The currents elicited at the test pulse at specific times after the conditioning pre-pulse were normalized against conditioning pulse-evoked current and plotted against time. At least two time constants (τ) of recovery from inactivation were obtained:τ1 = 1.3 ± 0.2 s and τ2 = 7.2 ± 1.6 s (n = 11).

