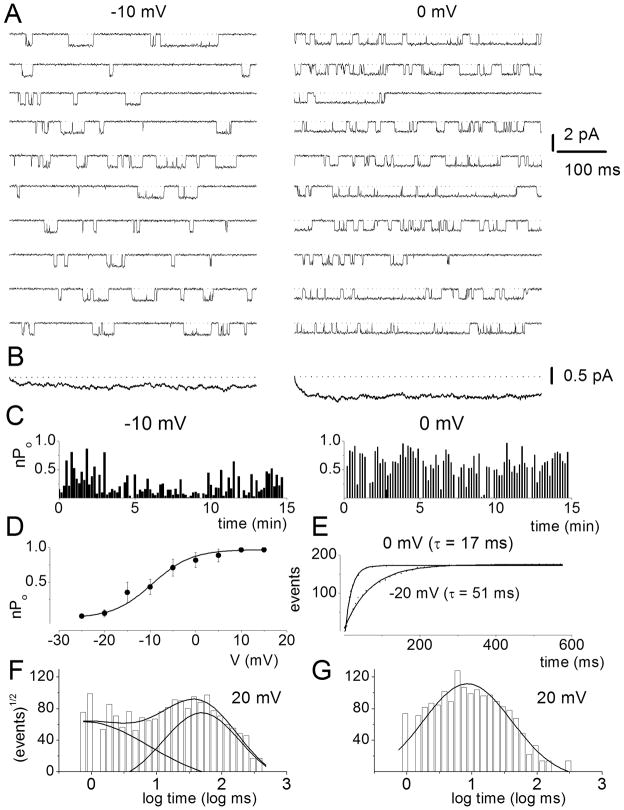
Figure 7. Voltage-dependence of L-type single-channel currents in adult spiral ganglion neurons.
A Representative consecutive single-channel traces of Ba2+ currents at test potentials −10 and 0 mV were obtained from L-type channel using the agonist, Bay K 8644 (5μM) in the bath solution. Ten consecutive traces are shown at the step potentials indicated, from a holding potential of −70 mV. B Ensemble-averaged currents at a given test potential were constructed from idealized current traces from ~400 consecutive sweeps. The ensemble-averaged current traces derived are shown at the bottom of each column of traces. C Diary of the channel open probability (Po) at test potentials of −10 and 0 mV are shown. Pos versus voltage relation for L-type channels were obtained from 500-ms voltage steps ranging from −25 to 15 mV. Each symbol represents the mean Po (including null traces) determined from 400 consecutive sweeps. The continuous solid line represents a single Boltzmann function fit to the data points. The half-activation voltage (V1/2) was −9.5 ± 2.4 mV (n = 7) and the slope was e-fold for 4.3 ± 1.2 mV (n = 7). E Voltage-dependence of first latency distribution in single-channel Ba2+ currents is shown. Cumulative first latency distribution plots were generated from the waiting time to first opening as a function of time, at the step voltages indicated. Exponential fits to the first latency distribution are drawn with solid lines. Time constants of the first latency distribution (τ) are indicated. F–G Dwell time histograms were binned logarithmically using 10 bins per decade and plotted with a square root transformation of the number of events. Open (F) and closed time (G) distribution were fitted with two open (τo1 and τo2) and two closed (τc1 and τc2) time constants, respectively. However, at some step voltages as shown (20 mV), the fast closed dwell time constant could not be resolved. For example at 0 mV step voltage τo1 = 1.7 ± 0.6 ms (n = 5) and τo2 = 37.0 ± 6.1 ms (n = 5) and τc1 = 0.6 ± 0.1 ms (n = 5) and τc2 = 13.2 ± 4.7 ms (n = 5). Moreover, at 20 mV step voltage as shown τo1 = 0.8 ± 0.3 ms (n = 6) [17%] and τo2 = 48.0 ± 6 ms (n = 6) [83%], and τc = 8.5± 1.2 ms (n = 6). The numbers in parentheses represent the percentage of time in which the channel dwells at the different states.

