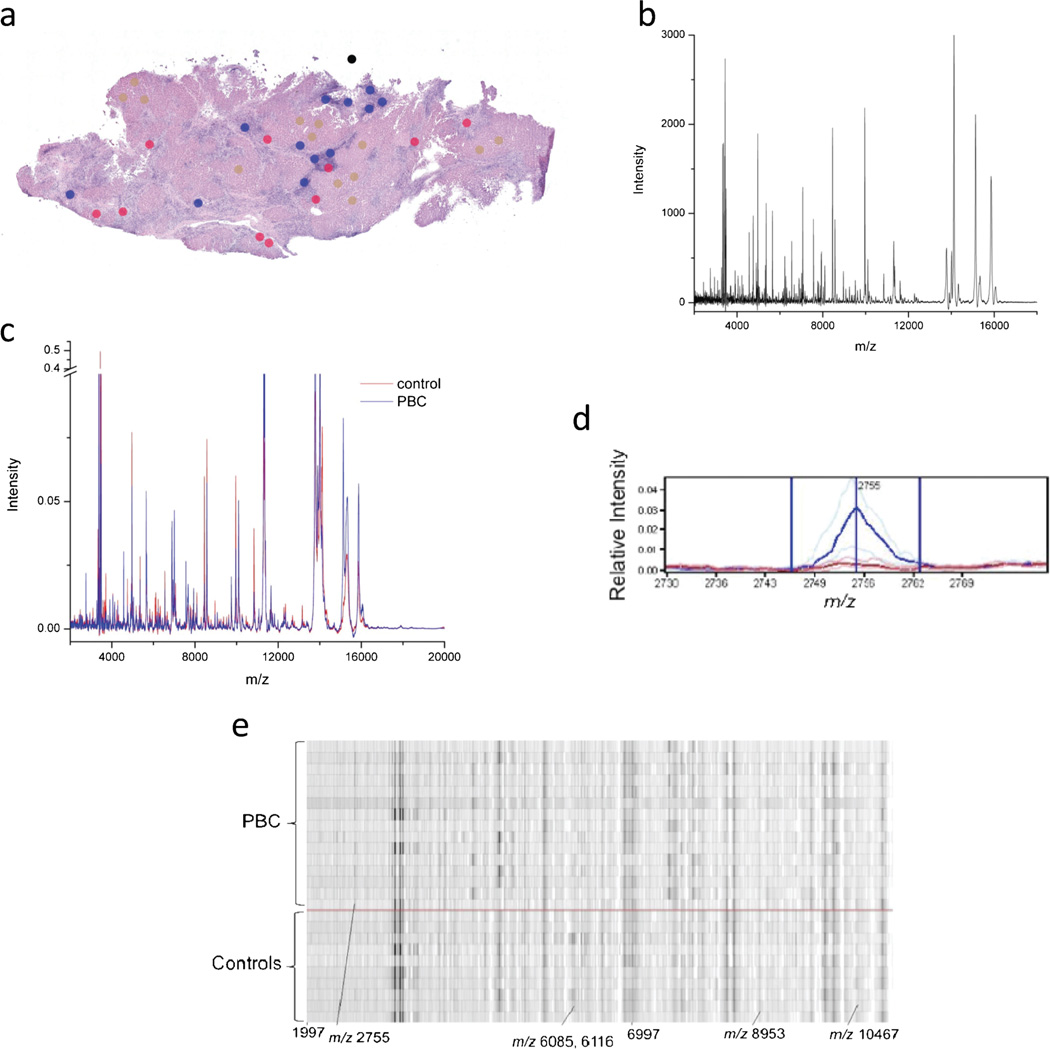
Figure 1.
Overview of data acquisition and analysis of MALDI MS data obtained from liver tissue. (a) Hematoxylin and eosin stained tissue sections were imaged and areas for MALDI MS are marked for bile duct (red), hepatocyte (brown) and inflammatory infiltrate (blue) profiling. Each dot represents the size of the matrix droplet deposited on the serial section utilized to acquire the MADLI MS data. (b) Raw data are acquired and processed with subtraction of background and normalization before averaging of replicas for each individual sample. (c) Processed spectra aligned and analyzed for differentially expressed peaks. Average (per group) spectra for controls (red line) and PBC (blue line). (d) Representative median spectra of a differentially expressed peak. Heavy and faint blue lines represent the median PBC peak and twenty-fifth and seventy-fifth percentiles, respectively. Similar red lines represent the control peaks. (e) Representative gel plot of PBC (above red line) and controls (below red line). MALDI MS, matrix-assisted laser desorption/ionization mass spectrometry; PBC, primary biliary cirrhosis.

