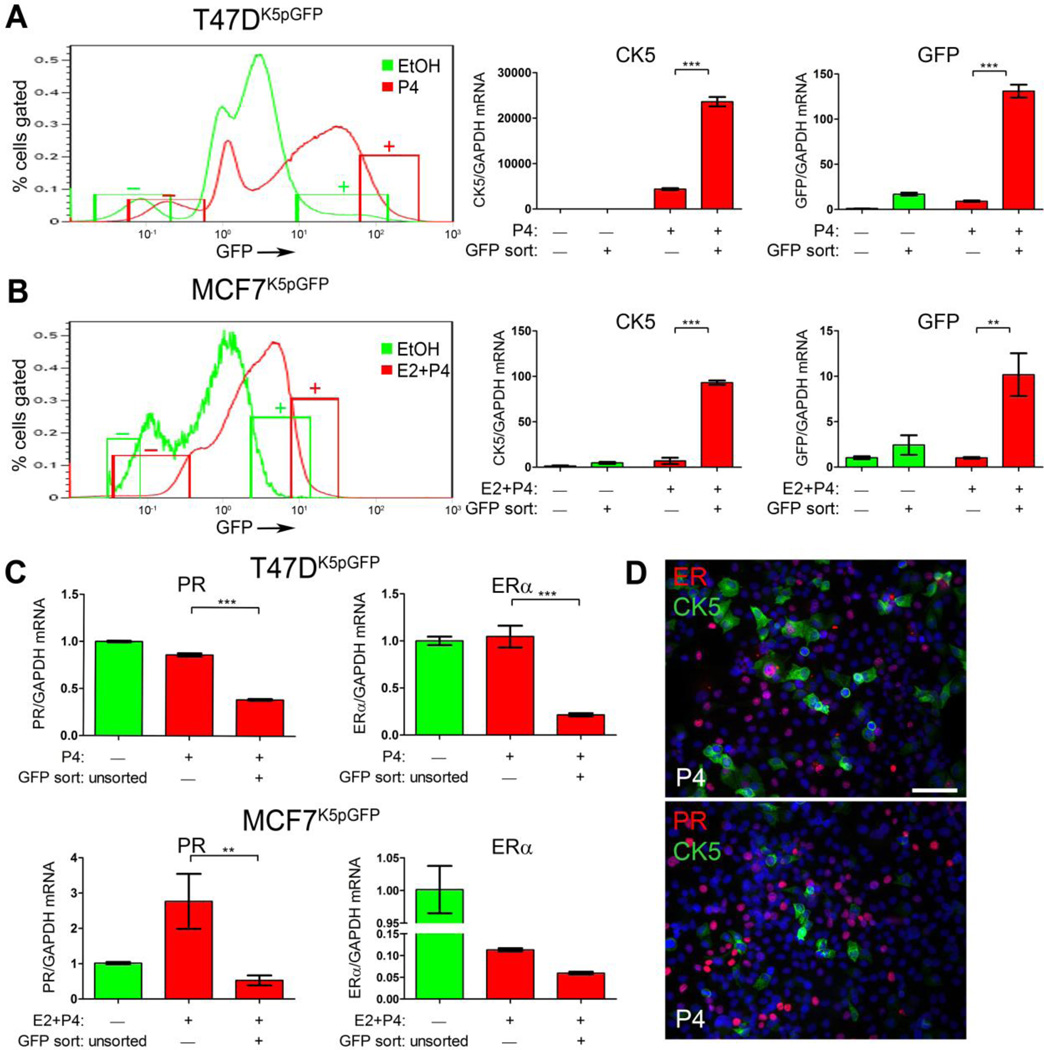
Figure 3. P4-treated CK5+ cells have reduced ER and PR mRNA levels.
A and B. T47DK5pGFP cells (A) were treated with vehicle (EtOH, green) or 100 nM P4 (red) and MCF7 cells (B) were treated with vehicle (EtOH, green) or 10 nM E2 + 100 nM P4 (red) for 24 h and GFP+/− cells sorted by FACS. Diagram indicates where the 10% GFP− and GFP+ fractions were collected. Relative levels of CK5 (center panel) and GFP (right panel) mRNA were measured by qPCR and normalized to GAPDH in GFP− and GFP+ fractions from each treatment. C. Relative levels of ER and PR mRNA in T47DK5pGFP (upper panel) or MCF7K5pGFP (lower panel) measured by qPCR and normalized to GAPDH in unsorted vehicle-treated and GFP− and GFP+ fractions of P4-treated cells. qPCR values represent mean δδCT normalized to vehicle-treated unsorted and GAPDH, ± SD (n=3). ** p<0.01, ***p<0.001 compared to vehicle-treated GFP−, one-way ANOVA/Tukey post test. D. Dual immunofluorescence for CK5 (green)/ER (red) or CK5 (green)/PR (red) in P4-treated T47D cells treated with EtOH or 100 nM P4 for 24 h. Scale bar, 50 µm.

