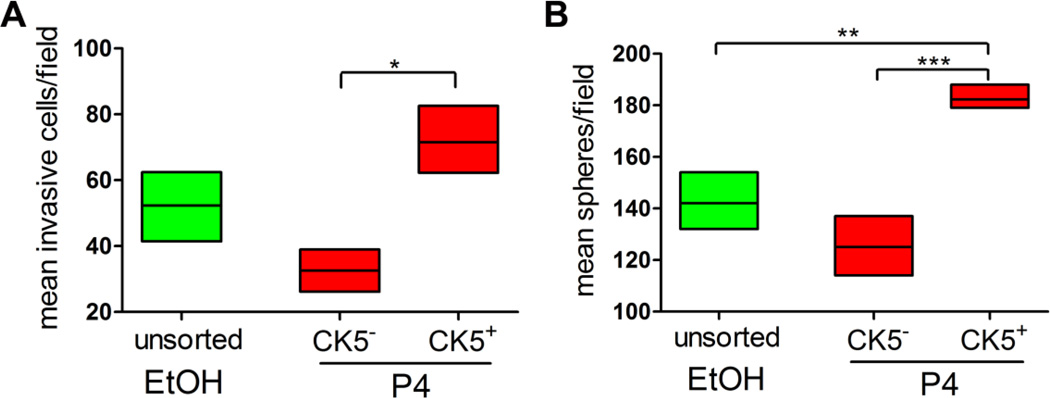
Figure 6. P4-induced CK5+ cells are more invasive and sphere-initiating than CK5− cells.
T47DK5pGFP cells were treated with vehicle (EtOH) or 100 nM P4 for 24 h and the GFP−/+ (CK5−/+) fractions isolated by FACS as described. A. Sorted cell fractions (50,000 each) were placed in invasion chambers for 24 h and the number of invading cells per field measured by Image J analysis (NIH). Graph of mean number of invasive cells per field for each condition. Boxes represent range and lines represent means. All sets were compared by one-way ANOVA/Tukey; *p<0.05, P4-treated CK5+ vs. CK5−. B. Sorted cells (300 each) were placed in mammosphere/3D-Matrigel culture, and the number of spheres ≥50 µm measured by automated counter after seven days. Graph of mean number of spheres per field for each condition. Boxes represent range and lines represent means. All data sets were compared by one way ANOVA/Tukey; **p<0.01, ***p<0.001, P4-treated CK5+ compared to all other groups.

