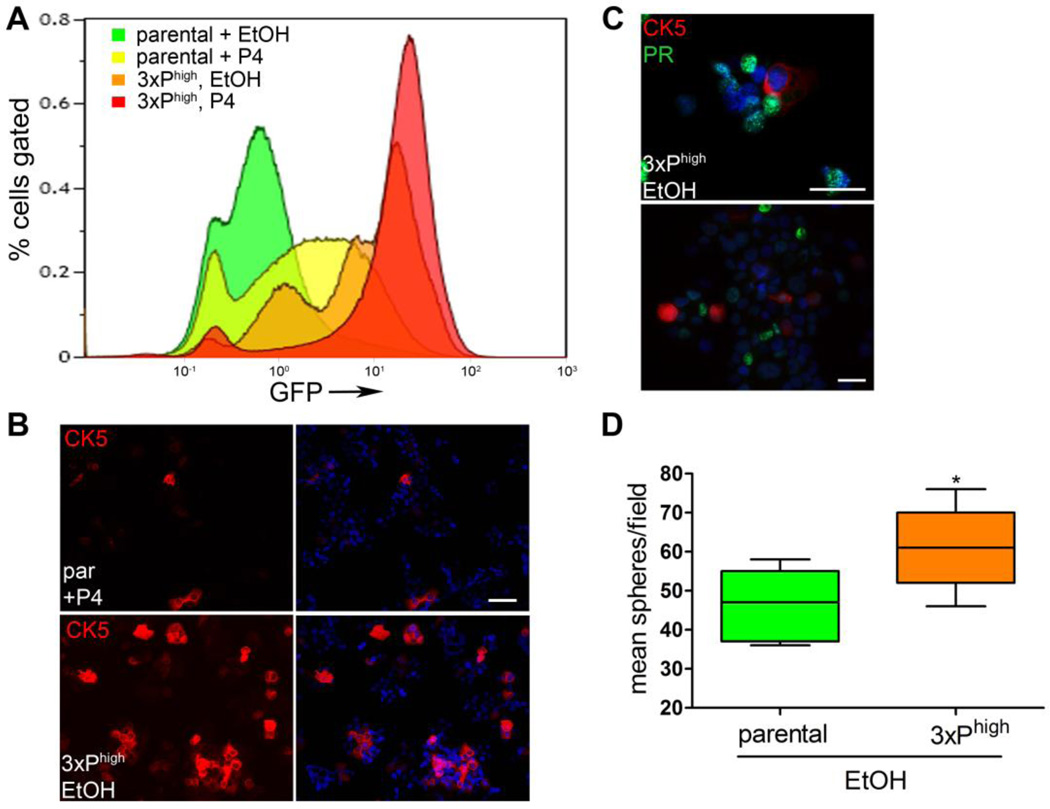
Figure 7. Serial selection of GFP+/CK5+ stem-like cells from T47DK5pGFP.
A. Diagram depicting a shift in the number and intensity of GFP+ cells upon triplicate P4 treatment and FACS isolation of the GFP+ fractions (3xPhigh). B. Immunofluorescence for CK5 (red) and DAPI (blue) in serial sorted cell line in absence of P4 (lower panel, “3xPhigh”), compared with parental control + 100 nM P4 for 24 h (parental (“par”), upper panel). Scale bar, 50 µm. C. Immunofluorescence for CK5 (red), PR (green) and DAPI (blue) in serial sorted cell line in absence of P4. Scale bar, 50 µm. D. Parental and serial sorted cells as in A were placed in mammosphere/3D-Matrigel culture (300 per well), and the number of spheres ≥50 µm measured by automated counter after seven days. Graph of mean number of spheres per field for each condition. Boxes represent range and lines represent means. *p<0.05, unpaired t-test.

