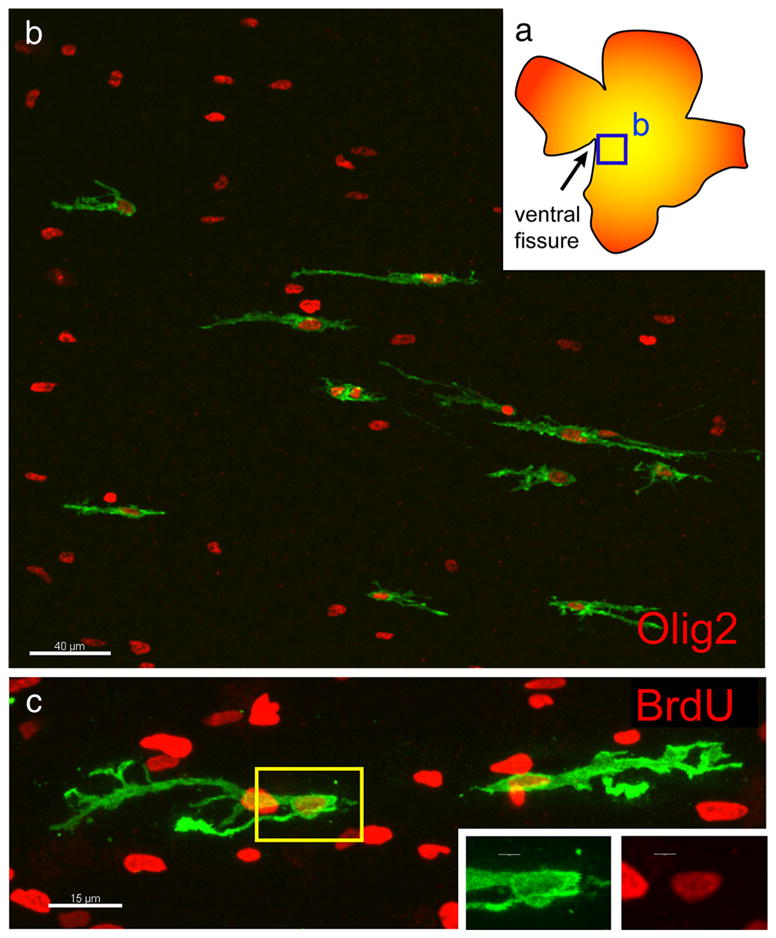
Figure 2.

Early glial cell migration and cell division. a, Diagram of retina imaged in b showing region close to the optic nerve head in which GFP +cells could be seen. b, GFP +cells derived from an E3 infection, harvested at E12, expressed Olig2 (red). Scale bar, 40 μm. c, E3 infected chick retina explanted for 1 d in vitro at E12 in the presence of BrdU (red), indicating that glial cells underwent S phase as they migrated. Yellow box indicates inset area. Scale bars: c, 15 μm; inset, 3 μm.
