Figure 6.
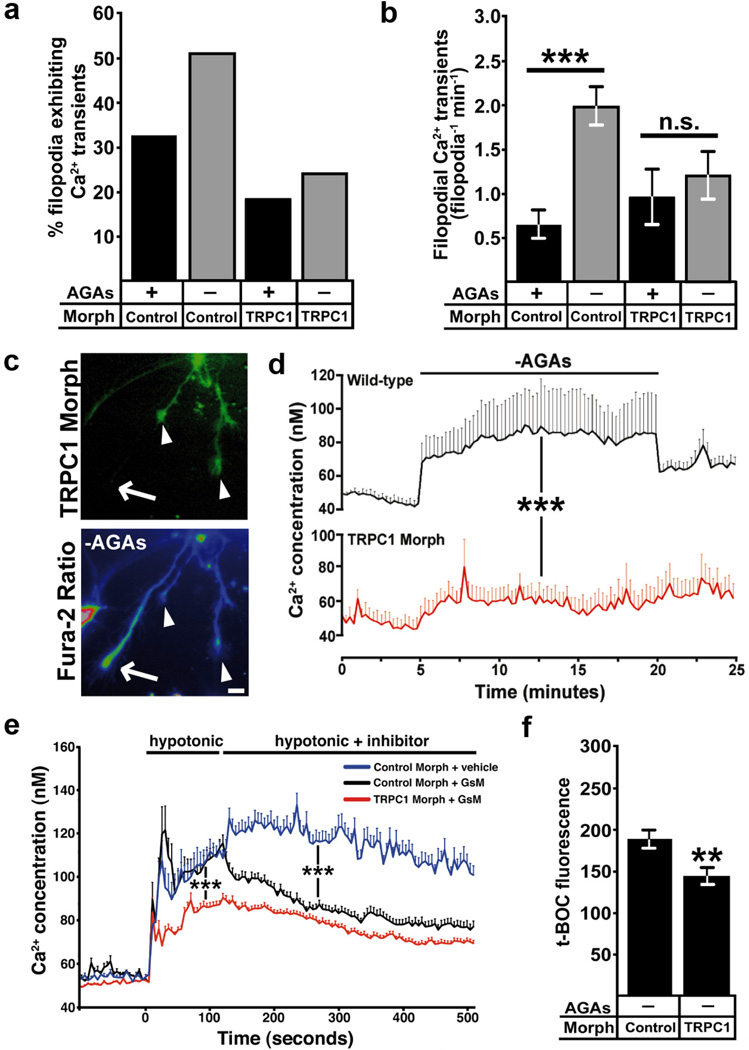
TRPC1 is required for mechanically induced Ca2+ influx and calpain protease activity in growth cones. a, b, Removing AGAs increases the incidence (a) and frequency (b) of filopodial Ca2+ transients in control morphant, but not TRPC1 morphant growth cones (n ≥ 188 filopodia for each condition, ***p < 0.001, Mann–Whitney test). c, d, Fura-2 ratiometric Ca2+ imaging shows that baseline [Ca2+]i increases in wild-type, but not TRPC1 morphant growth cones during removal of AGAs. c, eGFP (top) was coinjected with the TRPC1 morpholino to identify TRPC1 knockdown (arrowheads) and wild-type (arrows) growth cones. Note that wild-type growth cones exhibit a higher fura-2 ratio (bottom) compared with TRPC1 knockdown growth cones. Scale bar, 10 µm. d, Quantification of [Ca2+]i from wild-type and TRPC1 knockdown growth cones over 25 min during removal of AGAs (n ≥ 21 growth cones for each condition, ***p < 0.001, two-way ANOVA). e, Fura-2 ratiometric measurement of growth cone [Ca2+]i during mechanical stimulation with a hypotonic solution. In control morpholino growth cones, hypotonic solution induces a rapid increase in [Ca2+]i, which is partially blocked with GsMTx4. In TRPC1 knockdown growth cones, elevation [Ca2+]i in response to hypotonic solution is reduced and GsMTx4 causes no additional change (n ≥ 26 growth cone for each condition, ***p < 0.001, two-way ANOVA). Note that there is a significant residual Ca2+ elevation in response to hypotonic solution in TRPC1-morphant neurons, suggesting additional MS channels are expressed on growth cones. f, t-BOC fluorescence intensity values measured at 30 min after t-BOC addition and AGA removal in TRPC1 knockdown and control morpholino-injected neurons (n ≥ 40 growth cone for each condition, **p < 0.01, Mann–Whitney test).

