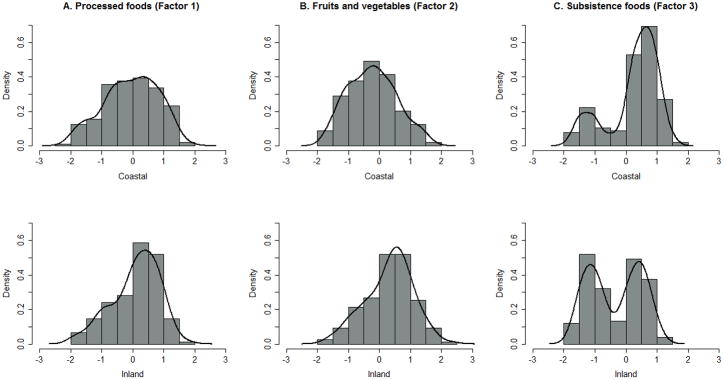
FIGURE 1.

Distributions of estimated factor scores for each factor by coastal and inland community with Gaussian kernel density line, x-axis refers to the natural log transformed estimated factor scores (n=358)

Distributions of estimated factor scores for each factor by coastal and inland community with Gaussian kernel density line, x-axis refers to the natural log transformed estimated factor scores (n=358)