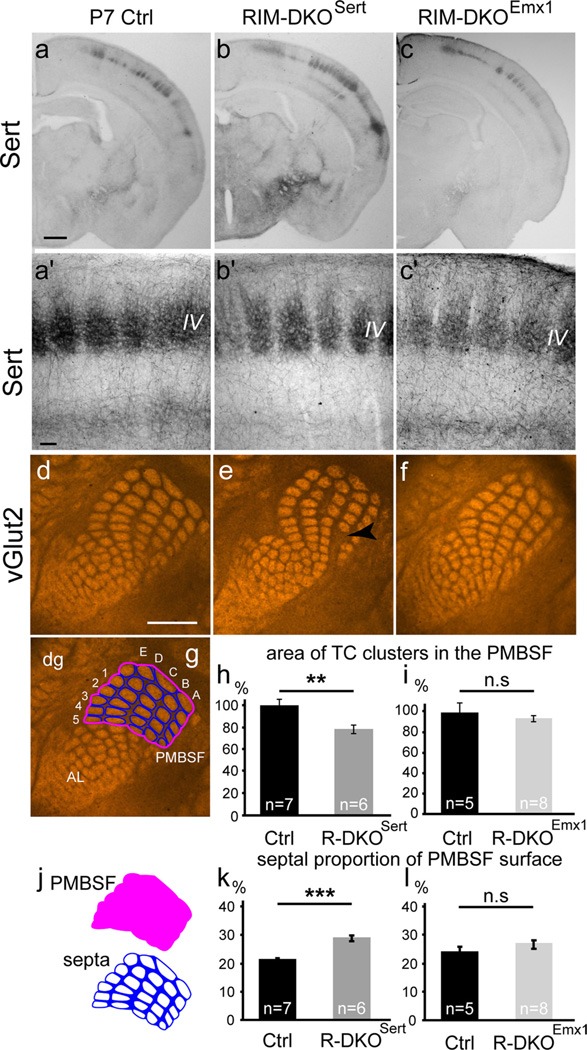
Figure 3.
Laminar and tangential distribution of TC axons in S1 of RIM-DKOSert and RIM-DKOEmx1 mice. a–c, To analyze the TC tracts and laminar distribution of TC axons in RIM-DKOSert and RIM-DKOEmx1 mice, SERT-immunocytochemistry was performed in coronal sections of P7 brains. In the three genotypes: control (a), RIM-DKOSert (b), and RIM-DKOEmx1 (c), thalamic axons reach the cortical layers VI and IV where they arborize into well delimited clusters (a′ –c′). d–f, To evaluate the topographic map formed by TC axons in a tangential plane, vGlut2 immunohistochemistry was performed on serial tangential sections of flattened cortical hemispheres of P7 mice. The sections through layer IV were photographed and analyzed. The TC clusters corresponding to the barrels of the principal whiskers in the PMBSF are clearly delimited in control (d) RIM-DKOSert (e) and RIM-DKOEmx1 (f) mice; Increase in the septal intervals between barrel rows in the RIM-DKOSert cortex is shown with arrowhead in e. g, j, quantification method: the PMBSF area was delimited by joining the external boundaries of the vGlut2 stained patches corresponding to the five rows of the main vibrissae (delineated in pink). The area covered by the individual TC patches/barrels was measured (white areas) and the septal area was calculated as the difference between these two areas (blue area). h, i, histograms showing the summed area of each individual patch in the PMBSF, normalized to area measured in the control, in the RIM-DKOSert (h) and the RIM-DKOEmx1 (i) mice; k, l, quantification of the septal/PMBSF area ratio in RIM-DKOSert (k) and RIM-DKOEmx1 (l) mice. AL: anterolateral barrel subfield, dg: digits; PMBSF: posteromedial barrel subfields, A–E: barrel rows, 1–5: barrel columns. Scale bars: a, 500 µm; a′, 100 µm; d, 1 mm.

