Figure 7.
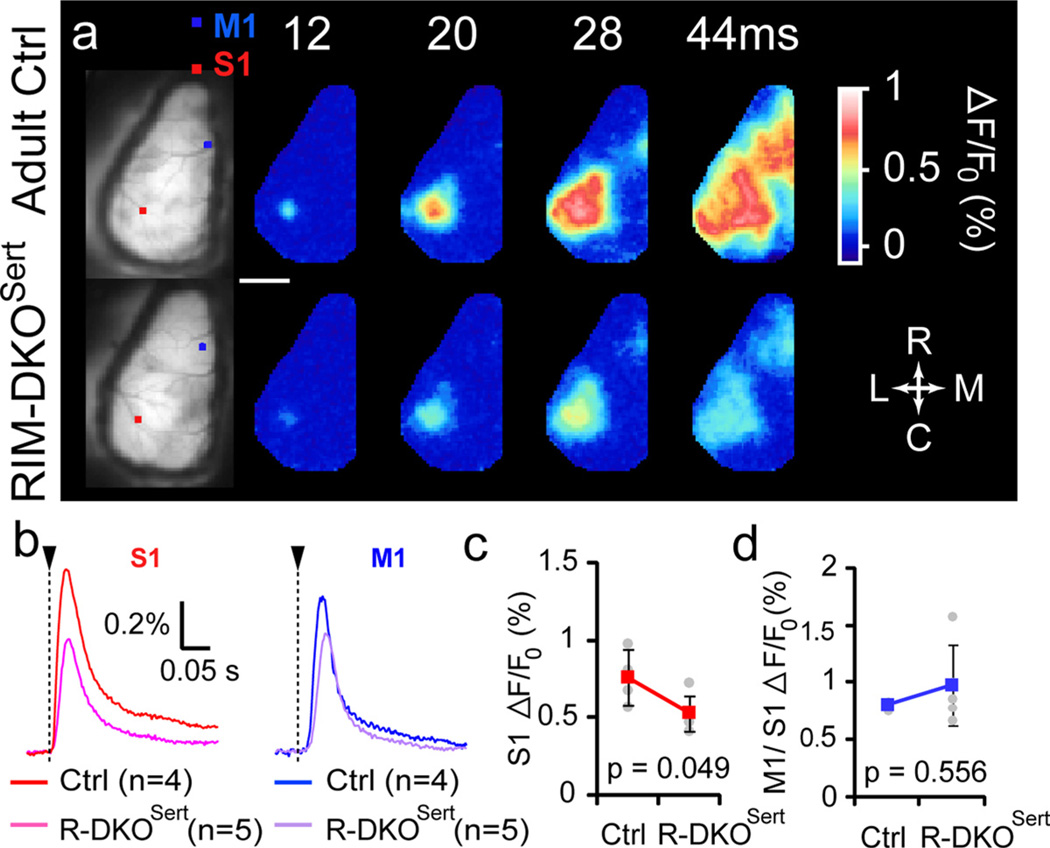
Cortical sensory processing is altered in RIM-DKOSert mice. a, VSD imaging of cortical activity evoked by single whisker (C2) deflection in control and RIM-DKOSert mice. Typical responses are illustrated in the upper panel: the first images on the left show resting fluorescence of VSD-stained unilateral craniotomies. The squares indicate the regions of interest used to quantify the signal on the C2 barrel column of the primary somatosensory cortex (S1, red square) and in the primary motor cortex (M1, blue square). Adjacent images show the VSD fluorescence changes at different times following a single right C2 whisker deflection. Scale bar, 2 mm. b, Averaged responses from control mice and RIM-DKOSert mice, quantified from S1 (left) and M1 (right). c, Peak amplitudes of the sensory responses measured in S1. d, Ratio M1/S1 (means ± SD for each group).

