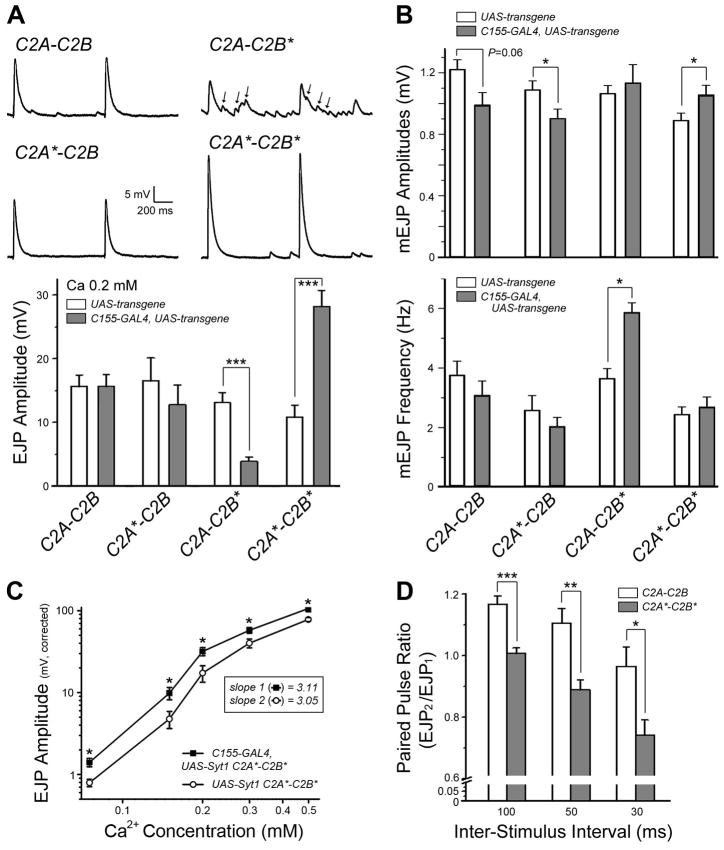
Figure 7.
Interplay between endogenous and transgenic Syt1 constructs on evoked synchronous release. A, (Top) Representative traces of two consecutive EJPs recorded in the presence of low [Ca2+]o (0.2 mM) are shown for wild-type larvae overexpressing the indicated transgenic Syt1 constructs. Scale bar, 5 mV and 200 ms. Asynchronous release events during stimulation are indicated with arrows. (Bottom) Mean eEJP amplitude is summarized for the indicated genotypes. Animals carrying each transgenic construct without a GAL4-driver (white) are served as controls for comparison with the same transgenic constructs driven by elavC155-GAL4 (gray). B, Mean mEJP amplitude (top) and frequency (bottom) are summarized for the indicated genotypes. Number of NMJs examined in (A) and (B) (control and transgene expression): C2A-C2B, 7 and 8; C2A*-C2B, 8 and 5; C2A-C2B*, 11 and 8; C2A*-C2B*, 10 and 11. C, Log-log plot for eEJP amplitudes at varying [Ca2+]o is shown for animals overexpressing the C2A*-C2B* construct (closed square) and its transgenic control without a GAL4-driver (open circle). The slope values calculated from a linear fit of the first three data points (0.075~0.2 mM [Ca2+]o) are indicated in the box. Number of NMJs examined (control and transgene expression): 7 and 11 at 0.075 mM [Ca2+]o; 7 and 11 at 0.15 mM; 6 and 11 at 0.2 mM; 6 and 10 at 0.3 mM; 6 and 9 at 0.5 mM. D, The ratios of eEJP responses in a paired-pulse stimulation paradigm are displayed for wild-type animals overexpressing the C2A-C2B (white) or C2A*-C2B* (gray) constructs. Number of NMJs examined (C2A-C2B and C2A*-C2B*): 8 and 6 at 30 ms interval; 8 and 7 at 50 ms; 8 and 7 at 100 ms. Mean and SEM are indicated in (A)–(D). ***, P<0.001, **, P<0.01, and *, P<0.05, student t-test for control (UAS-transgene) vs. neuronal expression (C155-GAL4, UAS-transgene) (A–C) or for neuronal overexpression of C2A-C2B vs. C2A*-C2B* (D).

