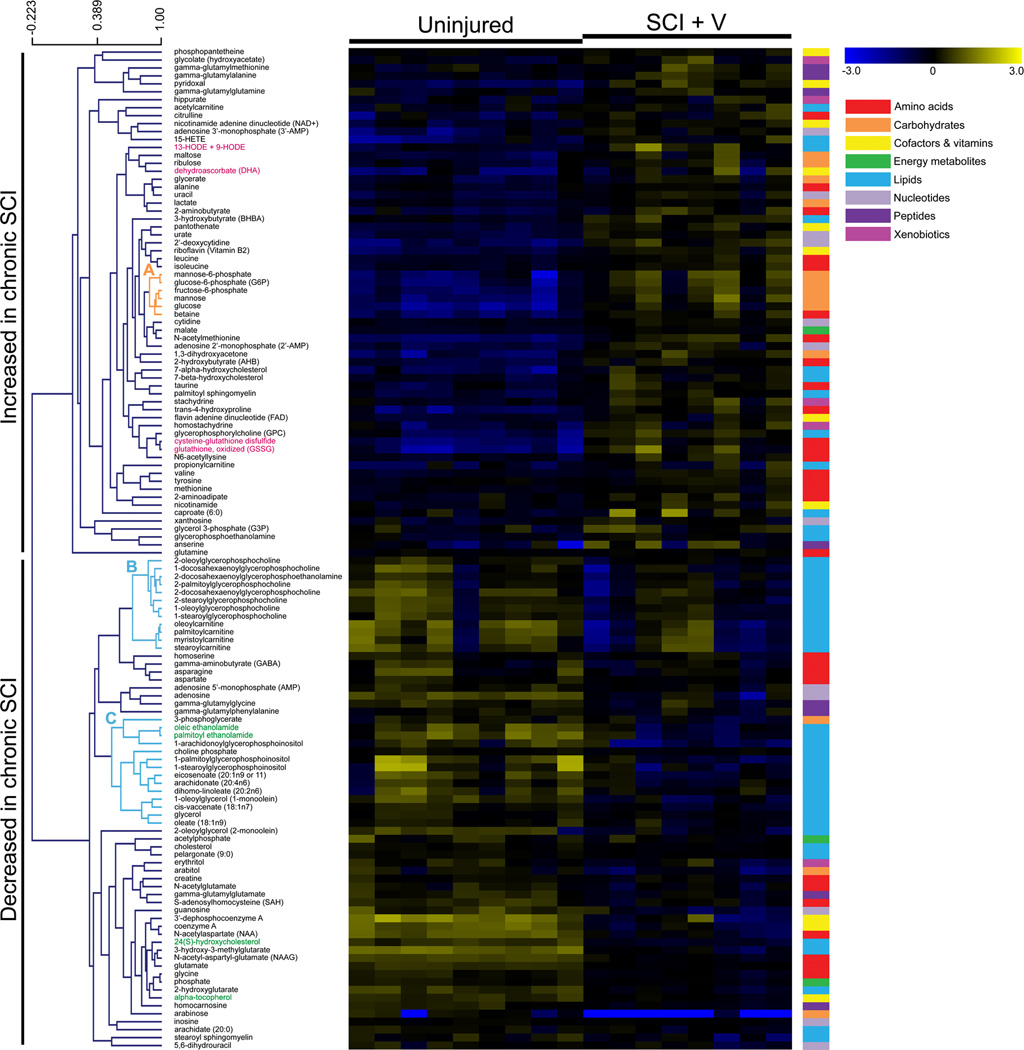
Figure 2.
Metabolic alterations in the spinal cord lesion site 9 months post-SCI. Heat map illustrates the relative change in levels of 126 metabolites with increased (yellow) or decreased (blue) expression in chronic SCI, vehicle-treated animals (n = 8) versus uninjured, age-matched controls (n = 9). Changes in concentration, relative to the median metabolite level, are indicated by intensity of color (see color scale, upper right). Metabolites are arranged by hierarchical clustering, with representative clusters of metabolites highlighted (A–C). Scale bar (upper left) indicates Pearson correlation coefficient (r). Colored bars (right) indicate super class of each metabolite (amino acids, carbohydrates, cofactors and vitamins, energy metabolites, lipids, nucleotides, peptides, and xenobiotics).

