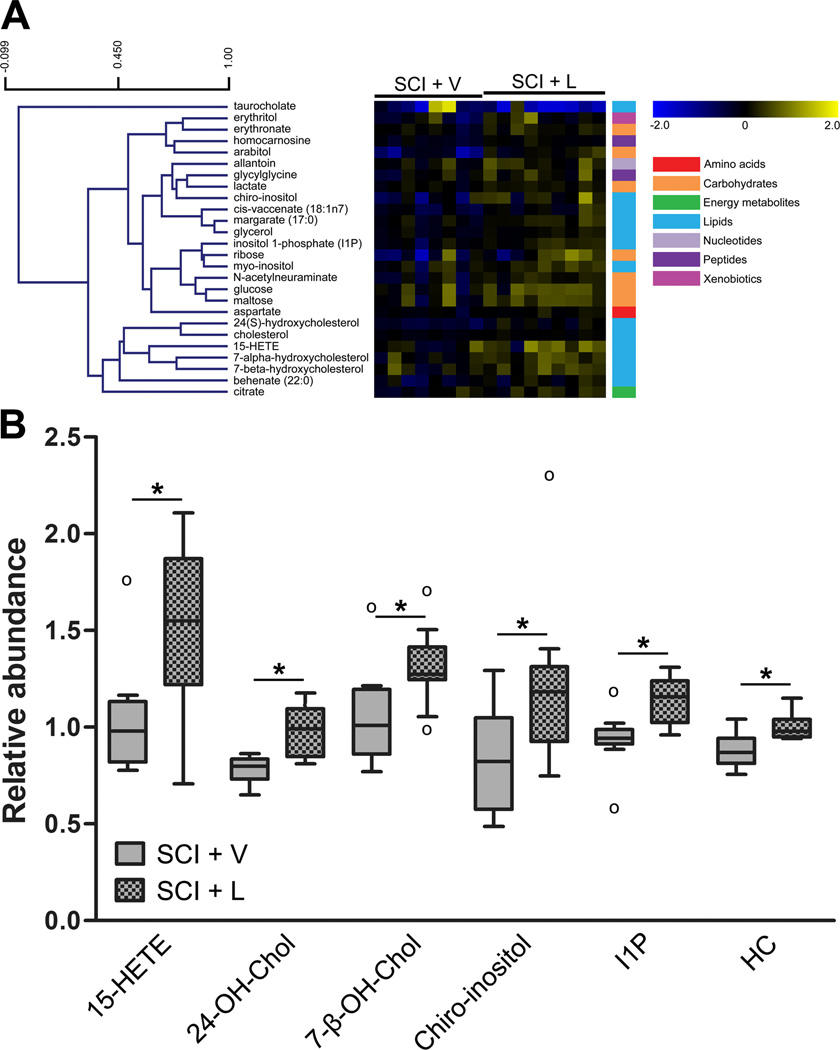
Figure 4.
Changes in the metabolomic profile of the chronically-injured spinal cord with licofelone treatment. (A) Heat map showing 26 metabolites with altered concentrations in chronic SCI, licofelone-treated animals (SCI + L, n = 9), compared to chronic SCI, vehicle-treated animals (SCI + V, n = 8). Metabolites are arranged by hierarchical clustering. Scale bar (upper left) indicates Pearson correlation coefficient (r). Colored bars (right) indicate super class of each metabolite (e.g., amino acids, carbohydrates). Increases (yellow) and decreases (blue) in concentration, relative to the median metabolite level, are indicated by intensity of color (see color scale). (B) Box plots illustrating changes in levels of select compounds within the chronic SCI, vehicle-treated (gray) or licofelone-treated (checkered) groups. For box legend, see Figure 3. *p < 0.05, Welch’s two-sample t test. Abbreviations: 15-HETE = 15-hydroxyeicosatetraenoic acid, 24-OH-Chol = 24(S)-hydroxycholesterol, 7-β-OH-Chol = 7-beta-hydroxycholesterol, HC = homocarnosine, I1P = inositol 1-phosphate.

