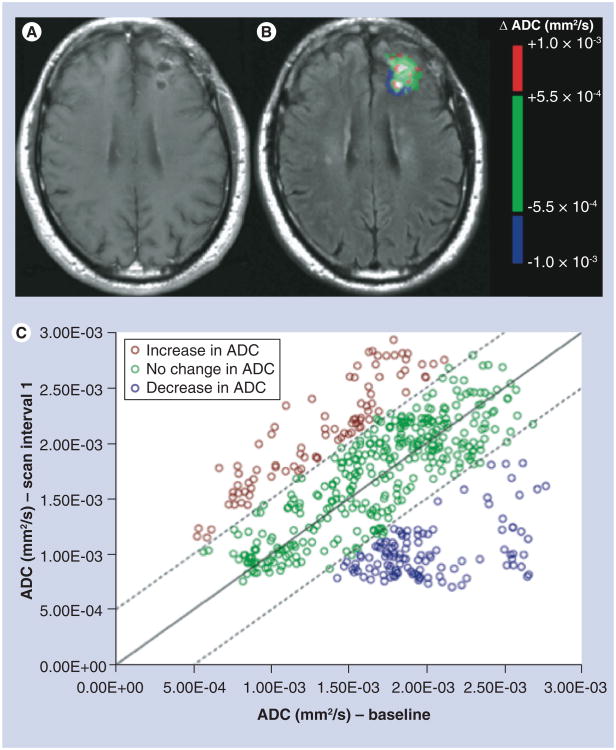
Figure 5. Example of voxel-wide analysis of diffusion changes within the contrast-enhancing tumor region of interest for a 55-year-old male patient, with a diagnosis of anaplastic oligoastrocytoma, after completing radiation therapy.
(A) A postcontrast image, (B) the colorized ADC threshold map (i.e., functional diffusion map) and (C) a graph showing the ADC changes of all pixels within the enhancing region of interest, with red, green and blue voxels representing increases (>5.5E-4), no change and decreases in ADC (<-5.5E-4), respectively.
ADC: Apparent diffusion coefficient.

