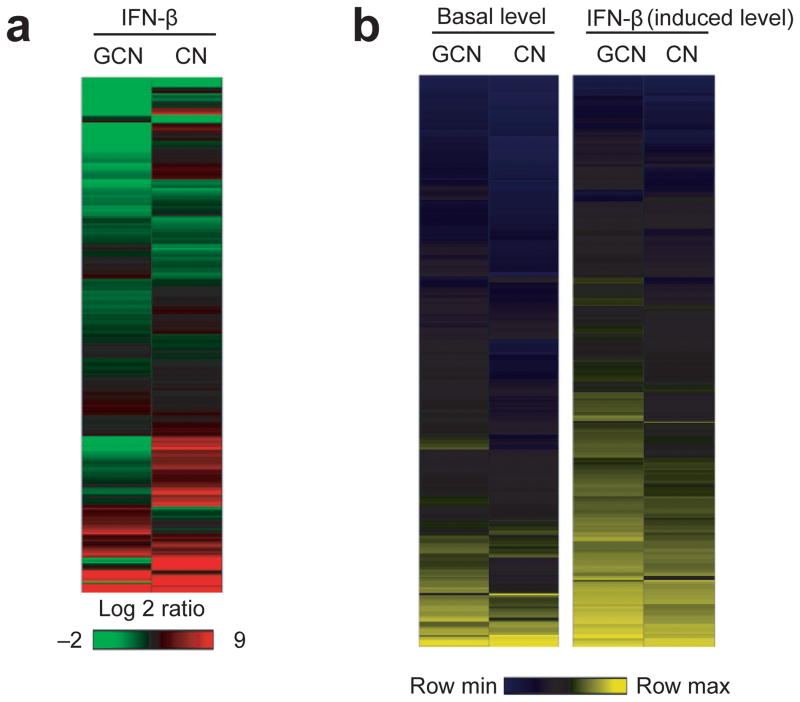
Figure 2. Microarray analysis reveals differential regulation of antiviral genes in GCN and CN.
(a) Global view of gene expression 24 hours after IFN-β treatment (100 IU/ml). Clustering was performed using the hierarchical unweighted-pair group method using average linkages with a Euclidean distance similarity measure and average value ordering function. Data shown was compared to values from mock-treated cells (fold change). (b) Differential gene expression profile of IFN-β responsive genes identified by ANOVA approach (within cutoff values of a ≥ 2-fold change, Benjamini-Hochberg-adjusted P value of < 0.01). Shown are heat maps reflecting expression of IFN-β responsive genes (rows) at the basal level (left columns) or after IFN-β treatment (right columns) in GCN and CN.

