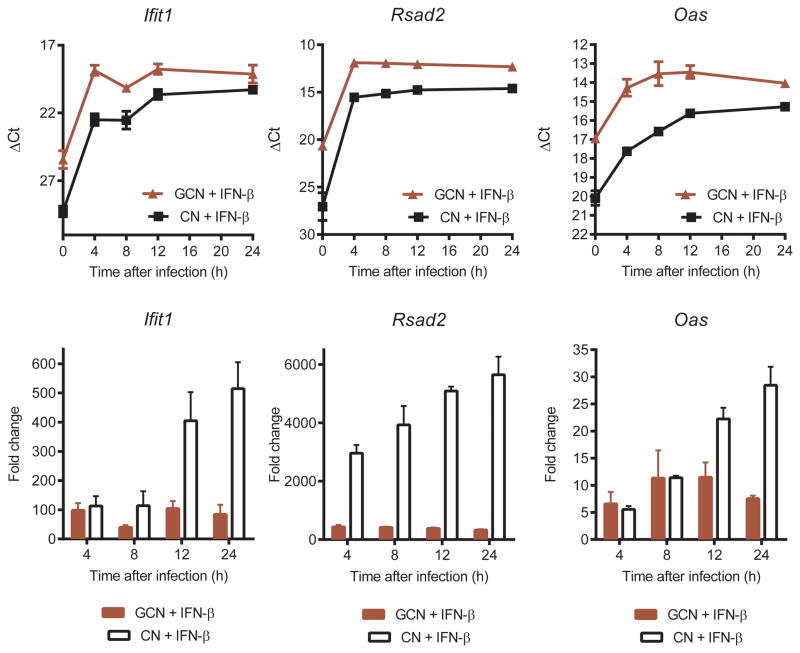
Figure 3. Key ISGs reach peak expression sooner and at higher levels in GCN.
GCN and CN were treated with IFN-β (100 IU/mL) and cellular RNA was harvested at the indicated time points after treatment. Expression level and induction pattern of selected genes was evaluated by qRT-PCR. The results are the representative of three independent experiments performed in triplicate. The data is displayed as (top) the ΔCt value compared to cellular levels of 18S ribosomal RNA or (bottom) the fold change in expression compared to untreated cells.

