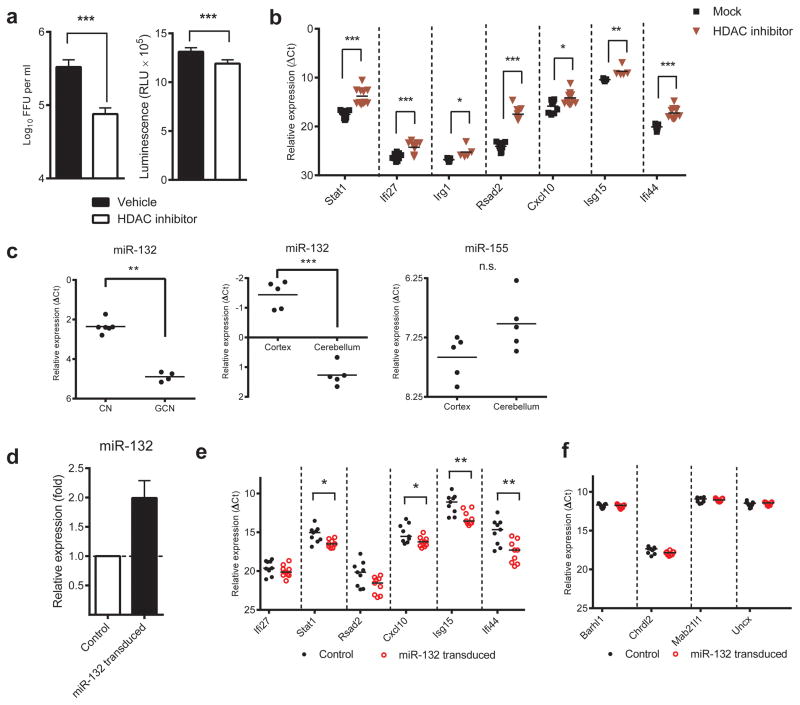
Figure 5. Epigenetic and microRNA-mediated control mechanism of ISGs.
(a) CN were pre-treated with HDAC inhibitor, trichostatin A (TSA, 500 nM) or vehicle (0.1% (v/v) DMSO) for 12 hours, infected with WNV (MOI of 1), and virus production in the supernatant 12 hours later was evaluated by focus-forming assay. Results are the average of three experiments performed in triplicate. Error bars indicate SD (***, P < 0.0001) (left). Twenty-four hours after TSA treatment, cell viability was determined using a Cell-titer Glo luminescence-based assay (right). (b) CN were treated with TSA and expression level of the indicated genes was evaluated by qRT-PCR. The results are the average of three independent experiments performed at least in duplicate. The data is displayed as the ΔCt value compared to cellular levels of 18S ribosomal RNA. Solid lines represent the median values and asterisks indicate statistically significant differences (*, P < 0.05; **, P < 0.01; ***, P < 0.0001). (c) microRNA-132 (miR-132) expression levels in total RNA isolated from GCN and CN were quantitated by qRT-PCR. The result is representative of four independent experiments with technical replicates of n = 2 to 6 per experiment. miR-132 and miR-155 (as a control) expression levels in total RNA isolated from cerebellum and cerebral cortex from five naïve C57BL/6 mice were quantitated by qRT-PCR. The data is displayed as the ΔCt value compared to cellular levels of sno202, a small RNA that is used commonly for microRNA normalization. Solid lines indicate median values. (d) miR-132, (e) ISGs, and (f) non-ISGs expression levels from total RNA isolated from GCN transduced with miR-132-expressing lentivirus were quantitated by qRT-PCR. The miR-132 level was normalized to the cellular level of sno202. Levels of ISGs were normalized to cellular level of 18S ribosomal RNA. Solid lines indicate standard deviations (miR-132) or median value (non-ISGs and ISGs). Asterisks indicate statistically significant differences (*, P < 0.05 **, P < 0.001; ***, P < 0.0001) as judged by the Mann-Whitney test.

