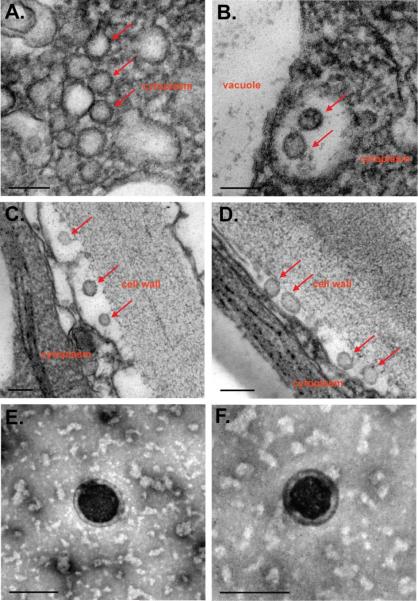
Figure 7.
Gag enveloped VLPs observed in situ by TEM. A – D. Representative sections from chemically fixed transgenic gag leaf tissue showing VLP production accumulation (red arrows) in cytoplasm (A.), in endosomes near the vacuole (B.) and within the apoplastic space (C. and D.). E and F. Representative negatively stained VLPs from VLP enriched extract of transgenic gag leaves. Bar represents 100 nm.

