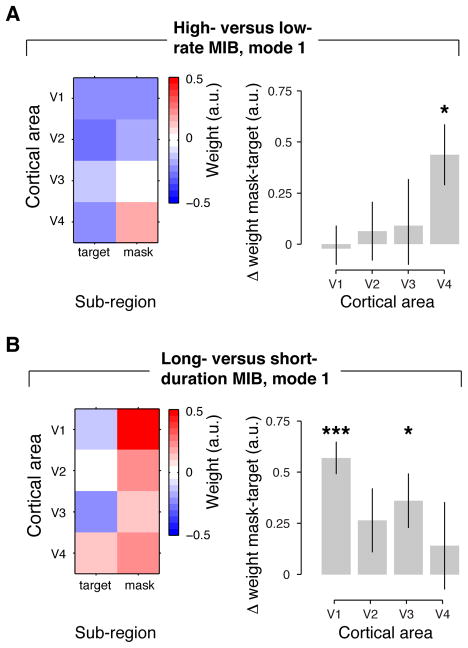
Figure 3. Spatial modes corresponding to differences in the dynamics of MIB.
(A) Difference between high- and low-rate MIB runs (median split based on disappearance rate). Left panel: Map of first spatial mode (same format as in Figure 1E). Right panel: Retinotopic specificity for individual cortical areas. Retinotopic specificity was computed as the mean difference in spatial mode weights for mask and target sub-regions. (B) Long- versus short-duration MIB (median split based on median duration of target disappearance). Same format as A. (Error bars, SEM across N = 6 subjects; *, p < 0.05; **, p < 0.01; ***, p < 0.001, two-sided t-tests).

