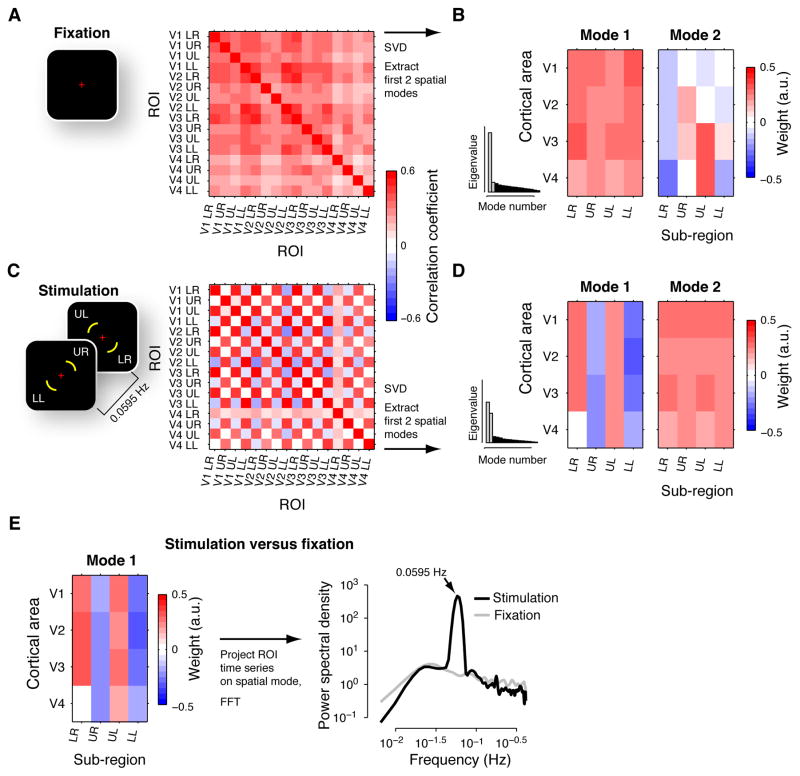
Figure 5. Spatial modes of activity during fixation and periodic stimulation.
(A) Correlation matrix for fixation. Left: Stimulus during fixation condition. Right: correlation matrix, averaged across subjects. Within each of V1-V4, four ROIs were defined as the subregions that corresponded retinotopically to a portion of each of the four visual field quadrants (see stimulus snapshot in panel C): “LR”, lower right quadrant of the visual field; “UR”, upper right; “UL”, upper-left; “LL”, lower-left. (B) Maps for the first two spatial modes during fixation, averaged across subjects, are shown along with histograms of the average eigenvalues (corresponding eigenvalues highlighted in gray). The spatial modes were re-organized as matrices (4 cortical areas × 4 sub-regions) for illustration. (C) Correlation matrix for periodic visual stimulation. Left: Snapshots of stimuli during periodic stimulation. Visual field locations in white are indicated for illustration only. Right: Correlation matrix, averaged across subjects. Same format as panel A. (D) First two spatial modes during periodic stimulation. Same format as panel B. (E) Difference between stimulation and fixation. Left panel: Map of the first spatial mode, averaged across subjects. Right panel: Power spectra of the spatial mode’s time series during fixation and stimulation. Note the prominent peak at the stimulation frequency (absent for fixation).

