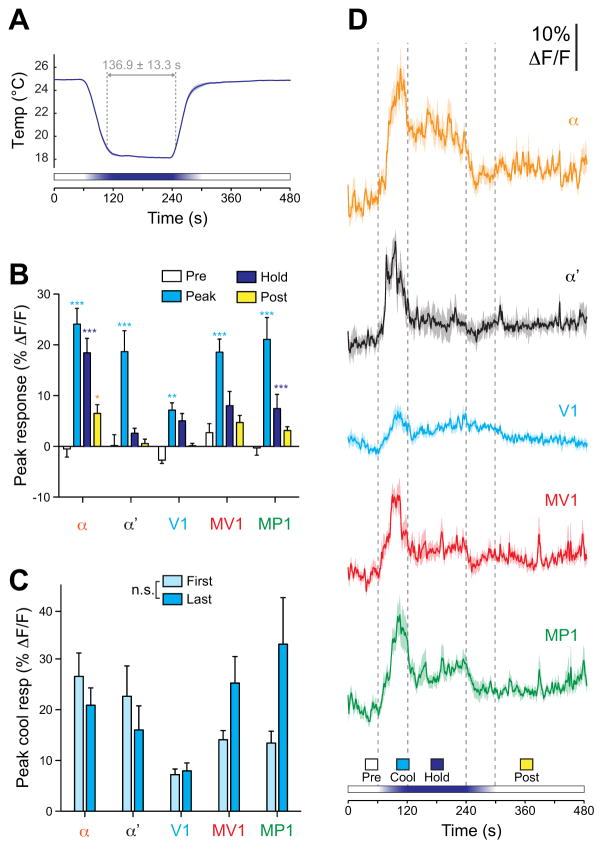
Figure 4.
Dopaminergic neurons responded transiently to sustained cooling. A. Temperature recorded next to the fly’s head during sustained cooling experiments. Mean (dark blue line) ± S.E.M (light blue surround) are graphed (n = 57). B. Response magnitudes during four time windows (Pre, Peak, Hold, and Post; see bottom of panel D) across each subset of dopaminergic neurons. *p<0.05, **p<0.01, ***p<0.001 (Bonferroni). C. Peak cooling responses graphed based on whether the cooling stimulus was presented first or last. These data are the same set as the peak cooling responses in panel B (pooled). There was no significant effect of presentation order (two-way ANOVA: F(4,1) = 1.96, p > 0.05). D. Responses of each subset of dopaminergic neurons to sustained cooling. Mean (dark lines) ± S.E.M (light surrounds) are shown. Vertical dashed gray lines show the beginning, peak, and end of the temperature shift.

