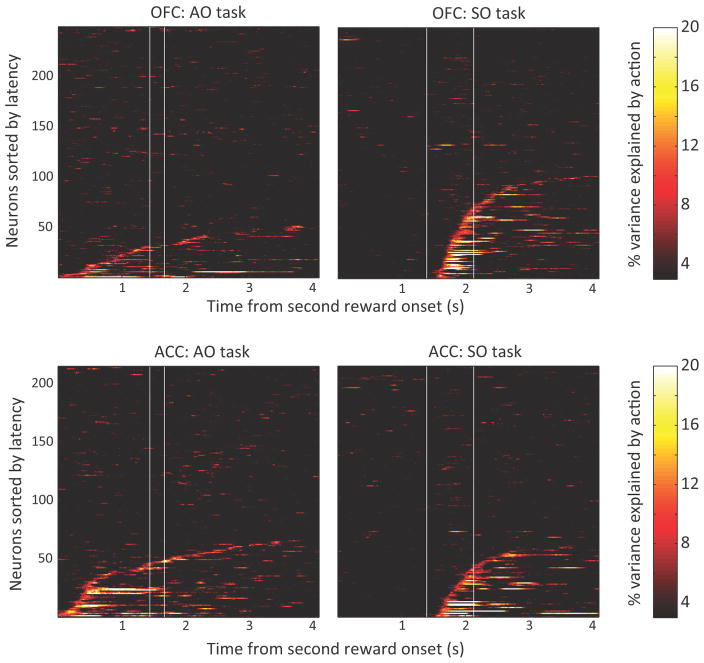
Figure 6.
Time course of encoding chosen action across the neuronal population. Each plot shows the percentage of variance in each neuron’s firing rate that can be explained by the chosen action for the AO task and the SO task. Neural selectivity is shown from the onset of the second reward. The first vertical line indicates the median time of the choice cue onset and the second vertical line indicates the median time of the chosen action. Each horizontal line is the selectivity from a single neuron, and they have been sorted on the basis of the latency of that selectivity. In the AO task, the chosen action begins to be encoded from the time of the onset of the second reward, and it is encoded by a significantly larger population of neurons in ACC than OFC. In the SO task, the chosen action cannot be encoded until the spatial position of the pictures is revealed. However, once this occurs, the information is encoded by a significantly larger population of neurons in OFC than ACC.

