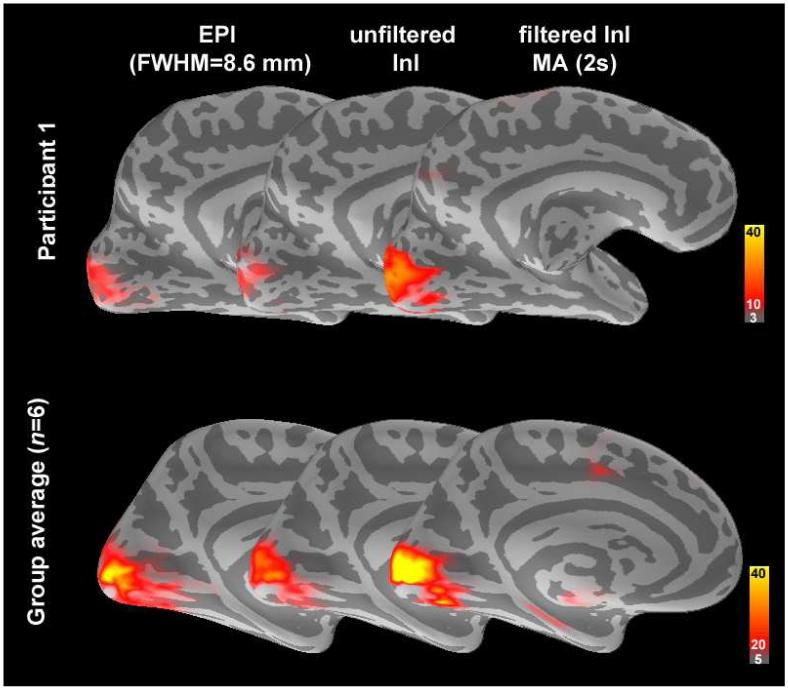
Figure 6.
A medial view of the inflated left hemisphere cortex overlaid with the z-statistic maps showing the spatial distribution of the active visual cortex before and after MA (2 s) filtering compared to the EPI data smoothed with a 8.6 mm FWHM kernel in single participant (top panel) and group (bottom panel). The dark and light gray indicate sulci and gyri respectively.

