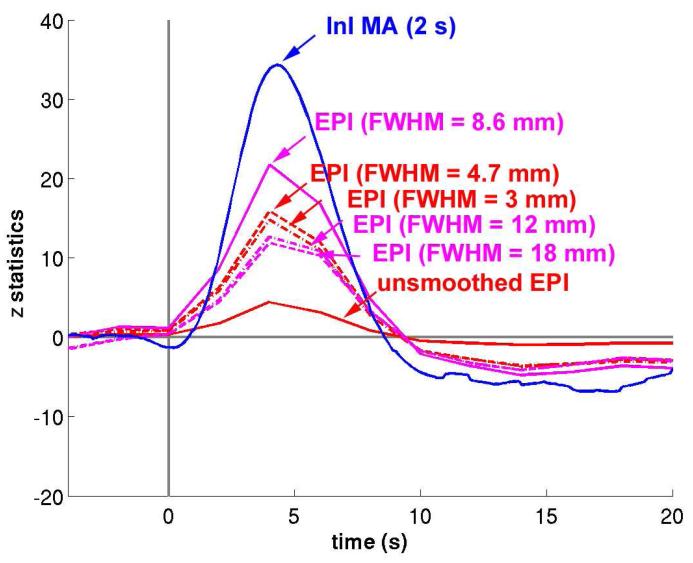
Figure 9.
The averaged z-statistic time course in the visual cortex using smoothed EPI data (solid red) and EPI data spatially smoothed by kernels with different widths. Among all EPI data, EPI smoothed by a kernel FWHM = 8.6 mm (solid magenta) has the maximal peak z-statistic value. InI data filtered with the MA (2 s) filter (solid blue) has a even larger peak z-statistic.

