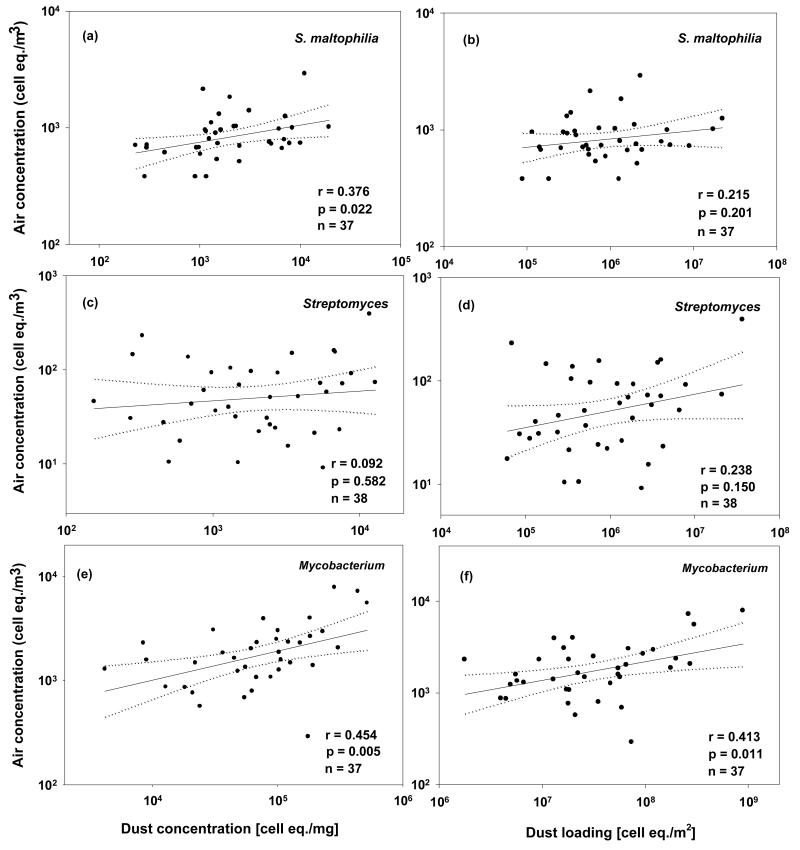
Figure 1.
Correlations between air concentration and dust concentration (a, c, e) and between air concentration and dust loading (b, d, f) for the three bacteria/genera. Dotted lines are 95% confidence lines. Correlation coefficients are based on Pearson product moment correlations between log-transformed outcome variables.

