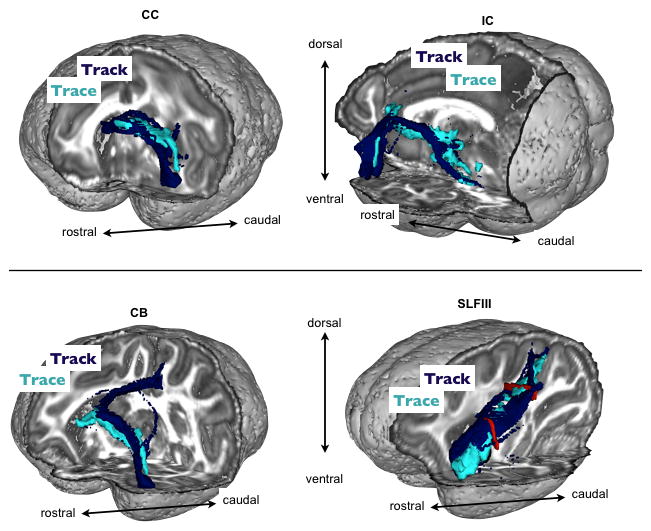
Figure 10.

Qualitative comparisons of the 3D trajectories of lOFC connections between tractography (tracking) and chemical tracing. Dark blue=tractography, light blue=tracer. Top panel shows connections to CC and IC. Bottom shows CB and SLFIII projections. The red colours in the bottom right figure show the two planar ROIs used as inclusion masks for the SLFIII connection.
