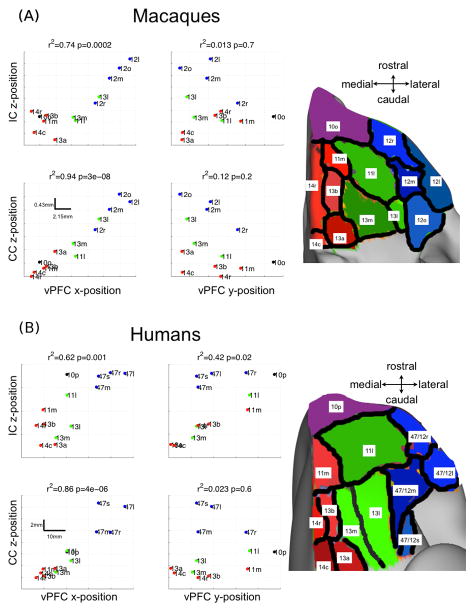
Figure 12.
Macaque (A) and human (B) whole vPFC analysis of WM projections in the IC and CC. Left panel: The scatter plots show the positions of the centres of gravity (COG) of the vPFC seed regions plotted against the COG of the pathways. It is clear that the x-position (medial-lateral) of the seed regions correlate significantly with the z-position (ventral-dorsal) of the IC and CC projections (R-squared statistics and p-values shown on the plots). This is not the case for the y-position (rostro-caudal) of the seed regions. Right panel: subdivision of the vPFC into 13 regions according to (Carmichael and Price, 1994) for macaques and (Ongur et al., 2003) for humans. The regions are coloured in red/green/blue according to their approximate medial-dorsal positions for ease of visualisation. Anterior regions 10o and 10p are coloured differently because they span both medial and central positions. The nomenclature of the regions follows the convention adopted by (Ongur et al., 2003). On the scatter plots in panel (B), the sub-regions 47/12x are simply labelled 47x.

