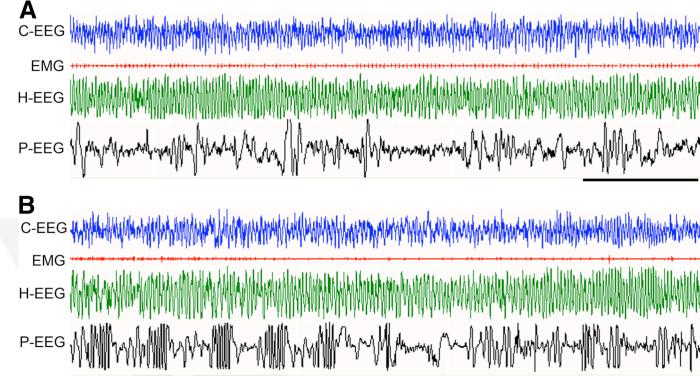
Figure 6.
Sample polygraphic appearance of REM sleep in a Failed-ext (A) and Ext (B) rat at ~1.5 h into the 6 h sleep—wake recording period that immediately followed the 45 min fear extinction training session. Note the qualitative similarity in both records showing characteristic electrographic signs of REM sleep: low-voltage, high-frequency waves recorded from the frontal cortex (C-EEG); neck muscle atonia (EMG); continuous theta waves in the hippocampal EEG (H-EEG); and P-waves (spiky waves) in the pontine EEG (P-EEG). Note that despite qualitative similarity, P-waves are more frequent in Ext animals than in Failed-ext animals. Time scale, 5 s.

