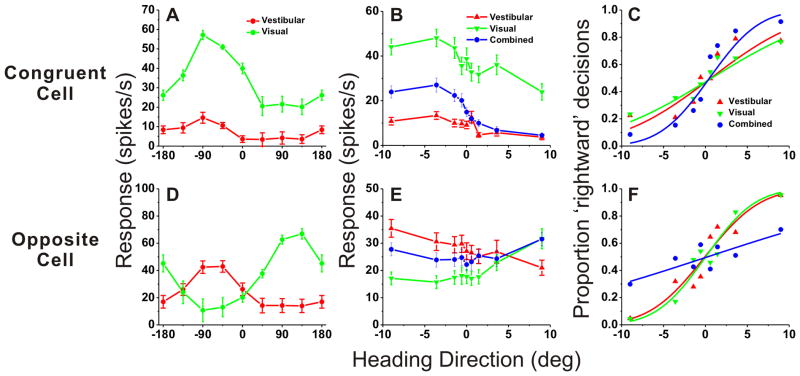
Figure 2. Examples of neuronal tuning and neurometric functions for one congruent cell (A–C) and one opposite cell (D–F).
(A),(D) Heading tuning curves measured in the horizontal plane for the congruent cell (Red: vestibular; Green: visual). 0° heading denotes straight forward translation, whereas positive/negative numbers indicate rightward/leftward directions, respectively. (B),(E) Responses of the same neurons during the heading discrimination task, tested with a narrow range of heading angles placed symmetrically around straight ahead (0°). (C), (F) Neurometric functions computed by ROC analysis. Smooth curves show best-fitting cumulative Gaussian functions. Neuronal thresholds were: Congruent cell (A–C): 8.6°, 10.6° and 4.7°; Opposite cell: 5.2°, 4.6° and 19.7°, for vestibular, visual and combined data, respectively.

