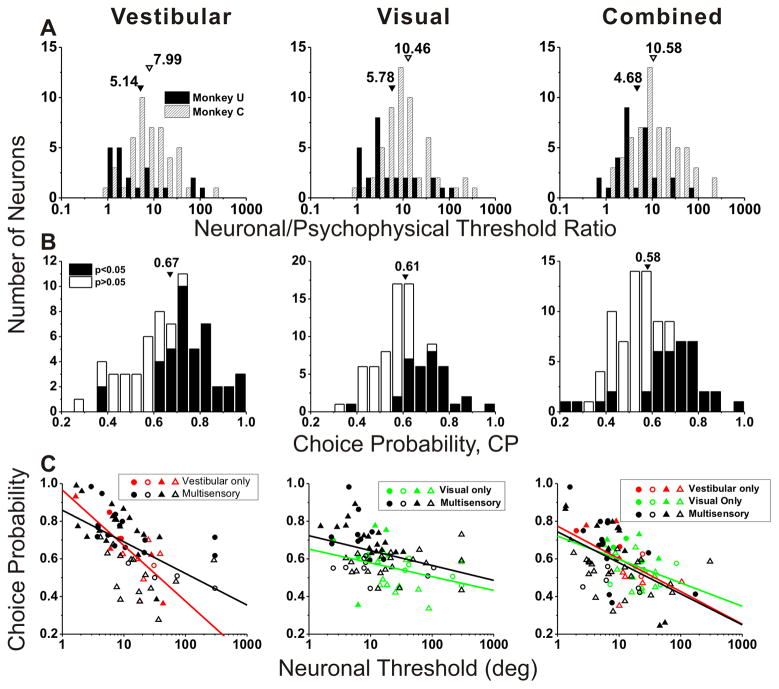
Figure 4. Summary of neuronal threshold and choice probability (middle 1s).
(A) Distributions of neuronal/psychophysical threshold (N/P) ratio for monkey U (filled bars) and monkey C (hatched bars). Arrowheads illustrate geometric mean N/P ratios. (B) Distributions of choice probability (CP), with filled bars denoting cells with CPs significantly different from chance (CP=0.5). Arrowheads illustrate mean values. (C) Choice probability plotted against neuronal threshold (circles: monkey U; triangles: monkey C), shown separately for vestibular-only (red, n=15), visual-only (green, n=24) and multisensory (black, n=56) cells. Filled symbols denote neurons for which the CP was significantly different from 0.5. Solid lines are linear regressions. Different columns show vestibular (left, n=71), visual (middle, n=80) and combined (right, n=95) responses.

