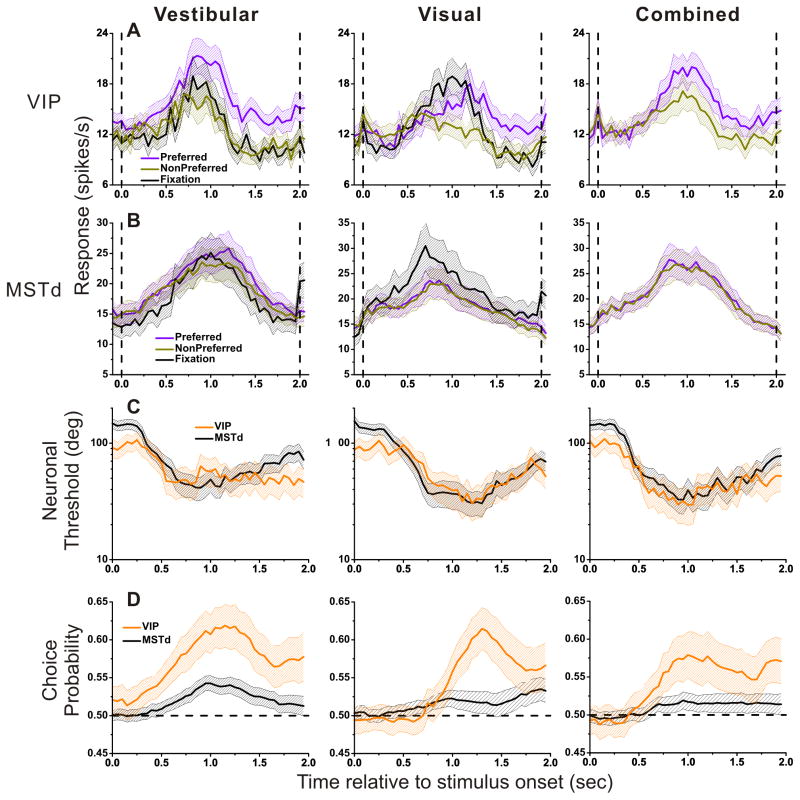
Figure 8. Time course of population responses, neuronal threshold and choice probability.
(A), (B) Average forward motion (0o heading) population responses from VIP (A) and MSTd (B). Data from the cell’s preferred (magenta) or non-preferred (cyan) choice are compared with data during passive fixation (black). Vertical lines indicate the onset and offset of the stimulus. (C), (D) Average neuronal thresholds (C) and choice probability (D) for VIP (orange) and MSTd (black) cells. Left: vestibular (VIP: n=71; MSTd: n=164), middle: visual (VIP: n=80; MSTd: n=178); right: combined (VIP: n=95; MSTd: n=182). Dotted horizontal lines in D indicate chance level (choice probability=0.5). All responses are computed from a 400 ms sliding window and a step size of 50 ms. Shaded areas around each mean illustrate 95% confidence intervals.

