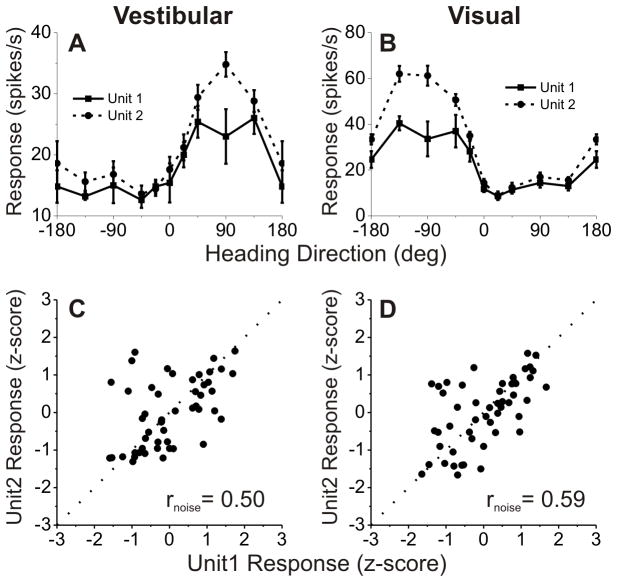
Figure 9. Measuring noise correlation (rnoise) between pairs of single neurons recorded simultaneously from the same electrode.
(A), (B) Examples of vestibular (A) and visual (B) heading tuning curves for a pair of simultaneously recorded VIP neurons (solid and dashed black curves). Responses are plotted as a function of heading direction in the horizontal plane, with 0° indicating a straight forward trajectory. Error bars: SEM. (C), (D) Normalized responses from the same two neurons were weakly correlated across trials during vestibular (C) and visual (D) stimulation, with noise correlation values of rnoise=0.28 and 0.18, respectively. Dotted lines mark unity-slope.

