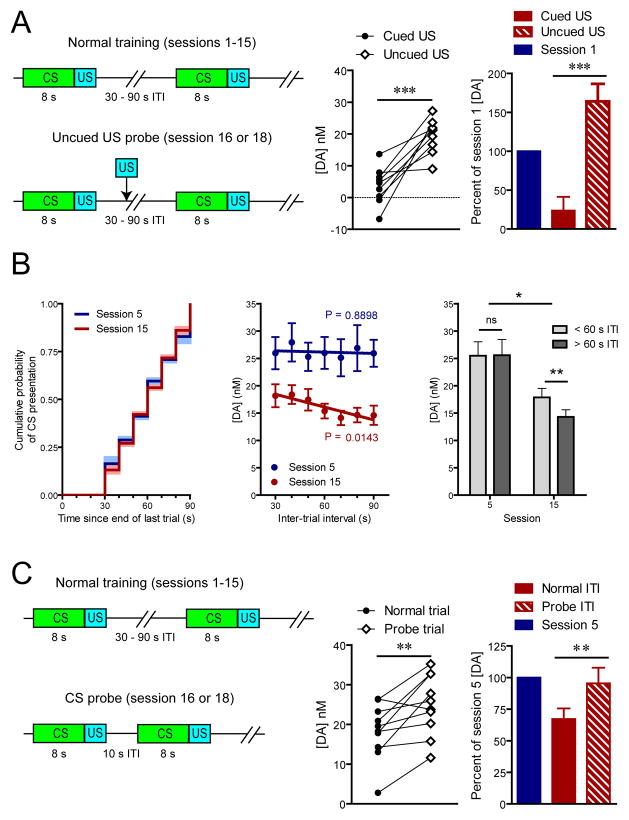
Figure 3.
Effect of temporal expectation on stimulus-evoked dopamine release. (A) Illustration of task design (left) and US-evoked dopamine during test sessions (center) relative to preconditioning level (right). (B) Experienced cumulative probability of CS presentation during session 5 and 15 (left), CS-evoked dopamine as a function of ITI length (center), and comparison of short to long ITIs at post-acquisition asymptote and after extended training (right). (C) Illustration of task design (left) and CS-evoked dopamine during the probe session (center) relative to peak levels at post-acquisition asymptote (right). Data are mean ± s.e.m. *P < 0.05, **P < 0.01, ***P < 0.005.

